Piet's Notes on Deep Creek Lake Science
Sensible Technologies - The Science of Deep Creek Lake
One of our (SPORE) objectives is to develop a water budget for Deep Creek Lake so that one can predict the water level in the lake. What this means is to develop the equations and collect the data necessary to account for all of the water flowing into and out of the lake. As will be seen, depending on how complex one wants to make it, the problem can be cast by simple equations with data used from the general literature for comparable systems.
What this means is to develop the equations and collect the data necessary to account for all of the water flowing into and out of the lake. Superficially this may seem like a relatively simple problem, but in reality it is quite complex. I shall discuss the various issues in this note and provide an order of magnitude analysis of the water budget. You can skip the details and go directly to the Conclusions.
The approach used is to determine the water budget using conservation of mass over a one year period. The basic equation of conservation of mass states:
$$water\ flowing\ in - water\ flowing\ out\ =\ change\ in\ storage\ - (1)$$
The term “change in storage,” for discussion purposes here, can be considered to be essentially the same as the “change in lake level.” To understand the various issues involved in developing a detailed model we shall first develop Equation (1) as a yearly average, meaning that the term on the right hand side is zero. After-all, if this weren’t the case, then either we have in increase of the water level every year, thereby flooding the surrounding areas, or the lake is drying out, leaving boats stranded, neither of which is happening. So Equation (1) is reduced to:
$$water\ flowing\ in\ =\ water\ flowing\ out\ - (2)$$
In the next section we shall describe in some detail the constituents of the inflow and outflow components and attach average annual values to them.
Certain abbreviations will be used in order to reduce the verbosity of the writing and complexity of the equations that will be presented. These are defined here:
We shall now consider the components of the individual terms. We start first with the left side of Equation (2), the waters flowing into the lake. There are really only three sources of water for the lake:
You might ask: “What about the streams flowing into the lake?” The streams and creeks derive their water from rain and groundwater. Their contributions will be accounting by the groundwater term, as will be seen later. Hence:
$$water\ flowing\ in\ =\ RW\ +\ GW\ - (3)$$
Rain water is a simple concept to understand, but groundwater is a much more complicated concept, which will be discussed in more detail later on. Let’s now look at the right hand side of Equation (2). This is made up of a series of components. Water leaves the lake via:
We can express these contributions in equation form as:
$$water\ flowing\ out\ =\ GEN\ +\ LEAK\ +\ RECHARGE\ +\ EVAP\ +\ PUMP\ - (4)$$
To evaluate equations (3) and (4) we have basically two options, either doing a detailed simulation, trying to account every second, or hour, or day, of how those parameters change, or we can develop a first-order solution, meaning that we just want the overall average values of the contributing parameters.
Clearly to do this accurately, meaning performing a simulation of the changes, say on an hourly basis, requires a lot of detailed information, much of which we don’t have in our possession. It also require the choice of an appropriate simulation tool. This can be done, and we have performed some initial simulations, but here we shall focus on an average, or order-of-magnitude, solution, specifically, a yearly average of the individual terms.
When you consider the seven right-hand side terms in equations (3) and (4), you can probably image that the ground water terms are going to be the most difficult ones to get a handle on. We shall try to determine its value from all the others. To be able to do this, we need some physical data about the lake to do our calculations.
The area of the lake surface is approximately 3,900 acres[1]. The area of the watershed, meaning the area that causes rain falling on it and flow into the lake, is approximately 40,940 acres [2]. While not stated specifically, I assumed that this includes the area of the lake. Hence to non-water landmass in the water shed is:
$$land\ area\ =\ 40,940\ -\ 3,900\ =\ 37,040\ acres\ - (5)$$
The average annual rainfall is found from various sources on the Internet to be between 40 and 50 inches per year. For example, [3] states 49 inches of water per year including water derived from melting snow. We shall use this number in our analysis. The exact number will not change our conclusions, as will be seen at the end. This number is used because it references the inclusion of snow as part of the value. So with the average rainfall per year and the area of the lake, it’s easily calculated how much water goes into the lake from direct rainfall on the lake surface.
$$rainwater\ =\ 3,900\ acres\ X\ 43,560\ sqft/acre\ X\ 49\ in/yr\ X\ 1ft/12\ in\ - (6)$$
$$rainwater\ =\ RW\ =\ 0.69\ X\ 10^9\ cf/yr\ - (7)$$
The amount of water flowing through the generators is computed from the knowledge of the characteristics of the turbines at the generator station and the annual production of the amount of electricity by the power station as reported by Brookfield Power, the operators of the hydro-electric plant. Clearly this number varies from year to year, but remember that we’re only after an approximate number. As long as it is “in the ballpark” it should allow us to draw valid conclusions. In 2007 [4] Brookfield reports generating annually 28,000 megawatt-hours. The hydro-electric project consists of two generators each producing 9 MW at flow-rates in the range of 270-330 cubic feet per second (cfs) [5]. For the present analysis we assume an average flow-rate of 300 cfs. The number of hours that the generator is in operation is hence easily calculated:
$$Hours\ of\ operation\ =\ 28,000\ MW-hours\ /\ (2\ X\ 9\ MW)\ =\ 1,555\ hours\ - (8)$$
The total amount of water leaving the lake via the generators during operation is:
$$Generator\ flow\ =\ 1,555\ hrs/year\ X\ 3,600\ sec/hr\ X\ ( 2 X 300 cfs)\ - (9)$$
$$Generator\ flow\ =\ GEN\ =\ 3.36\ X\ 10^9\ cf/yr- (10)$$
Leakage from the lake is composed of two basic components: water leaking under/through/around the dam structure (it’s basically a rock-filled earthen dam)
leakage through the powerhouse when the turbines are not operating. Both can theoretically be measured, but measurement systems to record such values are not are not in place, as far as we can detemine.
Leakage at the dam is probably quite constant throughout the year because the lake elevation does not vary that much relative to the base of the dam. Leakage at the dam collects into a stream, Deep Creek, that ultimately feeds into the Youghiogheny river. For now, we’re using the 4-yr average flow from the largest stream, Cherry Creek, flowing into Deep Creek Lake as an upper bound for the leakage through the dam (we hope to generate a measurement some time this summer).
From [6] this is easily calculated using an Excel spreadsheet. The flow-rate used is 4 cfs. Hence leakage at the dam is estimated as:
$$dam\ leakage\ =\ 4\ cfs\ X\ 3,600\ sec/hr\ X\ 24\ hr/day\ X\ 365\ days/year\ - (11)$$
$$dam\ leakage\ =\ LEAK\ =\ 0.13\ X\ 10^9\ cf/yr$$
The second leakage component is through the hydro-electric facility itself. It has basically three components components: leakage from the pennstock (the pennstock is the water conduit from the lake to the powerhouse) leakage through the wicket gates (the wicket gates are the control surfaces that guide the water from the exit of the pennstock, which is the inlet to the turbine, onto the turbines) leakage around the bypass valve (water can bypass the generators without generating power).
The pennstock was a problem some years ago, but that has presumably been fixed. Any leakage from the pennstock probably winds up as groundwater. For the present purposes it’s assumed to be negligible. The wicket gate leakage has always been an issue and changes with the age of the turbines. However, it can be measured at the plant’s outlet, the tailrace, since it is a flow going through the turbines. Leakage through the wicket gates has been estimated as high as 9 cfs [7]. The wicket gate leakage is only during the period when the plant is not operating. Equation 7 gives the number of hours that the plant is operating. Given that there are 365 x 24 hrs per year (8,760 hrs/yr), the wicket gate leakage duration is 8,760 -1,555 = 7,250 hours. Hence:
$$wicket\ gate\ leakage\ =\ 9\ cfs\ X\ 3,600\ sec/hr\ X\ 7,250\ hrs/yr$$ $$wicket\ gate\ leakage\ =\ 0.23\ X\ 10^9\ cf/yr$$
The third leakage component, around the bypass valve, is assumed to be negligible, because it should be small, but more importantly, because we have no information on it.
$$LEAK\ =\ dam\ leakage\ +\ wicket\ gate\ leakage\ =\ (0.13\ +\ 0.23) X\ 10^9 cf/yr$$
It stands to reason that there are some areas around the lake that leak water out of and away from the lake. We have no specific knowledge of such conditions, and hence it will be assumed to be negligible. It’s effect is folded in automatically in the ground water term of Equation (3).
$$RECHARGE\ =\ 0\ cf/yr$$
Removal of water from the lake via surface evaporation is a complex process depending on a host of variables. The most commonly used method in the US for estimating evaporation from small, shallow water bodies, is to measure evaporation from a standard pan and then multiply the result by a coefficient, generally called the pan coefficient. We are not aware of any such measurements for Deep Creek Lake. Evaporation requires energy, the principle source being solar radiation. But there are a host of other contributing factors, such as wind, water clarity, water temperature, air temperature, and relative humidity. Pan evaporation was measured over a ten year period at the Savage River Dam[8]. For the period May-Oct the average pan evaporation was 29.46 inches. The other months have negligible evaporation. To convert to real evaporation requires the use of a pan coefficient. This number is generally around 1.3 [9]. Hence:
$$evaporation\ =\ 29.5\ inches/(1.3\ inches/yr)\ X\ 1ft/12\ in\ X\ 3,900\ acres\ X\ 43,560\ sqft/acre$$ $$evaporation\ =\ EVAP\ =\ 0.42\ X\ 10^9\ cf/yr$$
There are several commercial concerns that have MDE permits to extract water directly from the lake. The water is generally pumped into holding ponds. The permit holder that we are aware of are are Wisp Resort for snow making in the winter time and golf course irrigation during the summer time, ASCI to operate the water park during the summer months, and Thousand Acres to irrigate the golf course during the summer time. We don’t have any good numbers for these at the present time. The maximum pumping capacity at the Wisp is 8,750 gpm [10]. We assume that half of the pumped water returns directly into the lake via melt an runoff; the other half via sublimation and groundwater recharge. Assuming they pump 2 days per week for the 4 month skiing season, the net amount removed from the lake is is estimated to be:
$$pumped\ =\ 0.5\ x\ 8,750\ gpm\ x\ 1\ cfs/450\ gpm\ x\ 2\ days/month"
$$24\ hr\ =\ day\ x\ 3,600\ s/\ 1\ hr\ x\ 4\ month/yr$$
$$pumped\ =\ PUMP\ =\ 0.0068\ x\ 10^9\ cf/yr
The golf irrigation needs and ASCI uses are significantly less than the snow making requirements and from the above result can therefore assumed to be negligible.
Substituting (10), (15), (18) and (20) into Equation (4), and (7) into Equation (3) and normalizing to billions of cubic feet (divide by 10+9) gives the following equality:
$$0.36\ +\ GW\ =\ 0.13\ +\ 0.23\ +\ 0.42\ +\ 0.0068$$ $$GW\ =\ 0.427\ x\ 10^9\ cf/yr$$
What this result says is that to maintain an equilibrium of the lake level from year to year, groundwater has to flow into the lake by the amount specified by Equation (22).
Equation (22) gives the total amount of groundwater required to have a beginning and ending lake level that is the same from year to year. Where groundwater comes from and is recharged is a complex issue. Ultimately, one way to look at the issue, all groundwaters come from rain. What happens subsequently can be broken down into a number of components that are more easily estimated on an individual basis. What are these components? Here, we classify them into the following categories:
All of this can be expressed by equation 23:
$$groundwater\ =\ rain\ -\ runoff\ -\ streams\ -\ evaporation\ -\ transpiration\ -\ wells\ -\ springs$$ (23)
Estimating these terms is difficult, but we’ll give it a try. The non-lake area of the watershed is specifies by Equation (5). Rain is computed similar to Equation 6 except that the area is the watershed area less the lake area:
$$rainwater\ =\ 37,040\ acres\ x\ 43,560\ sqft/acre\ x\ 49\ in/yr\ x\ 1ft/12\ in (24)$$ $$rain\ =\ 6.59\ x\ 10^9\ cf/yr \right(25)$$
Runoff is estimated using values reported in [11]. They estimated 0.7 m/yr based on precipitation of 1.35 m/year (=53.1 inches/year). Scaling this to the presently assumed rainfall gives:
$$runoff\ =\ 0.7m/yr\ x\ 3.28\ ft/m\ x\ (49.0/53.1)\ x\ 37,040\ acres\ x\ 43,560\ sqft/acre\ \right (26)$$
$$runoff\ =\ 3.45\ x\ 10^9\ cf/yr\ \right(27)$$
Well water withdrawals are estimated from the usage data estimated by the Garrett County Department of Public Utilities. The estimated consumption for the Deep Creek Lake watershed is about 200,000 gallons/day. Per year this translates to:
$$wells\ =\ 200,000\ gallons/day\ x\ 0.1337\ cf/gallon\ x\ 365\ days/yr - 28$$ $$wells\ =\ 0.0098\ x\ 10^9\ cf/yr\ (round-off\ to\ 0.01) - 29$$
The contribution from water withdrawals by private wells is estimated to be negligible.
The contribution by springs from the lake bottom is impossible to estimate. Their contribution will be assumed to be zero and folded in with the remaining groundwater contribution term.
Because much of the area of the watershed is covered by trees, it is assumed that the ordinary evaporation from the surface is included in the evapotranspiration term, to be evaluated next.
So what we have left is evapotranspiration, a complex term to evaluate.
Evapotranspiration is a term used to describe the sum of evaporation and plant transpiration from the Earth’s land surface to the atmosphere. Evaporation accounts for the movement of water to the air from sources such as the soil, canopy interception, and waterbodies, here taken to be the tributaries to Deep Creek Lake. Transpiration accounts for the movement of water within a plant and the subsequent loss of water as vapor through stomata in its leaves. These processes are shown schematically in Figure 1 below.
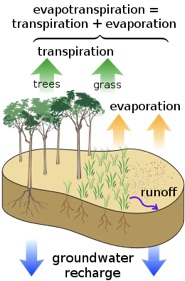
Figure 1. Evapotranspiration.
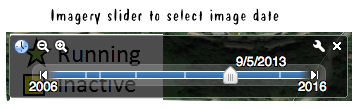
Figure 2. The Image Selector Tool in Google Earth.
Consider that over the entire land surface of the globe, rainfall averages around 750 mm (29.5 inches) during a year, of which some two thirds is returned to the atmosphere as evapotranspiration, making evapotranspiration the largest single component of the terrestrial hydrological cycle. For example, a large oak tree can transpire 40,000 gallons (151,000 liters) per year [12]. Suppose we have such large trees here in the lake watershed on 40 ft centers. You would have 27 such trees per acre [13]. If they were to cover the whole of the watershed such trees could transpire the following amount of water: $$transpire\ =\ 27\ trees/acre\ x\ 37,040\ acres$$ $$40,000\ gallons/tree/yr\ x\ 0.1337\ cf/gallon - (30)$$ $$transpire\ =\ 5.35\ x\ 10^9\ cf/yr\ - (31)$$
A great number of studies have been performed to estimate transpiration from tree and plant canopies. [15] includes the effects of mountainous terrain. Total seasonal evapotranspiration was reported for several ecosystems and varied from 40 to 61 cm of water. We shall assume 50 cm here. Hence, another estimate for the Deep Creek area is:
$$transpire\ =\ 50\ cm/yr\ x\ 0.328\ ft/cm\ x\ 37,040\ acres\ x\ 43,560\ sqft/acre\ - (32)$$ $$transpire\ =\ 2.65\ x\ 10^9\ cf/yr\ - (33)$$
This latter value is probably a better estimate. Let’s first rearrange Equation 23, include evaporation into the transpiration component and fill in the numbers in billions of cubic feet:
$$groundwater\ +\ streams\ +\ springs\ =\ rain\ -\ runoff\ -\ transpiration\ -\ wells\ - 34$$ $$groundwater\ +\ streams\ +\ springs\ =\ 6.59\ -\ 3.45\ -\ 2.65\ -\ 0.01\ =\ +0.48 bcfy\ - (35)$$
Compare the result of Equation (35), 0.48 bcfy, with that of Equation (19), 0.427 bcfy, shows a remarkable agreement, give the number of assumptions about the applicability of data from other areas. If the result from Equation 35 were to be much less than that of Equation (19) that would indicate some groundwater from outside of the lake watershed would have to recharge the lake. The level of accuracy of the analysis suggests that only lake watershed groundwater recharges the lake.