
A Rule of Thumb
There is always a need for a rule of thumb to estimate approximate, but reasonable values, of certain quantities. One of these is “How much does the lake level drop when the generators operate for 1 hour?” This is the topic of this note. A simple graph is produced that shows the drop of the lake level per hour at a given lake level when both turbines operate at their design flows. Unfortunately, the literature gives different values for the design flow through the generators, hence curves are generated for these various design flows. Not discussed is how much the flow changes through the generators when the lake level drops one foot. It’s assumed that this is not much, since the design conditions for change in elevation of the water from lake level to turbine inlet is 440 feet when the lake level is at 2461 ft.
1. Introduction
It is handy in the analyses of the effects of TERs, white-water releases, and discretionary releases to understand the impact of one or many hours of generator operation on the the lake level. This note summarizes how the set of curves, shown in Figure 1, have been generated.
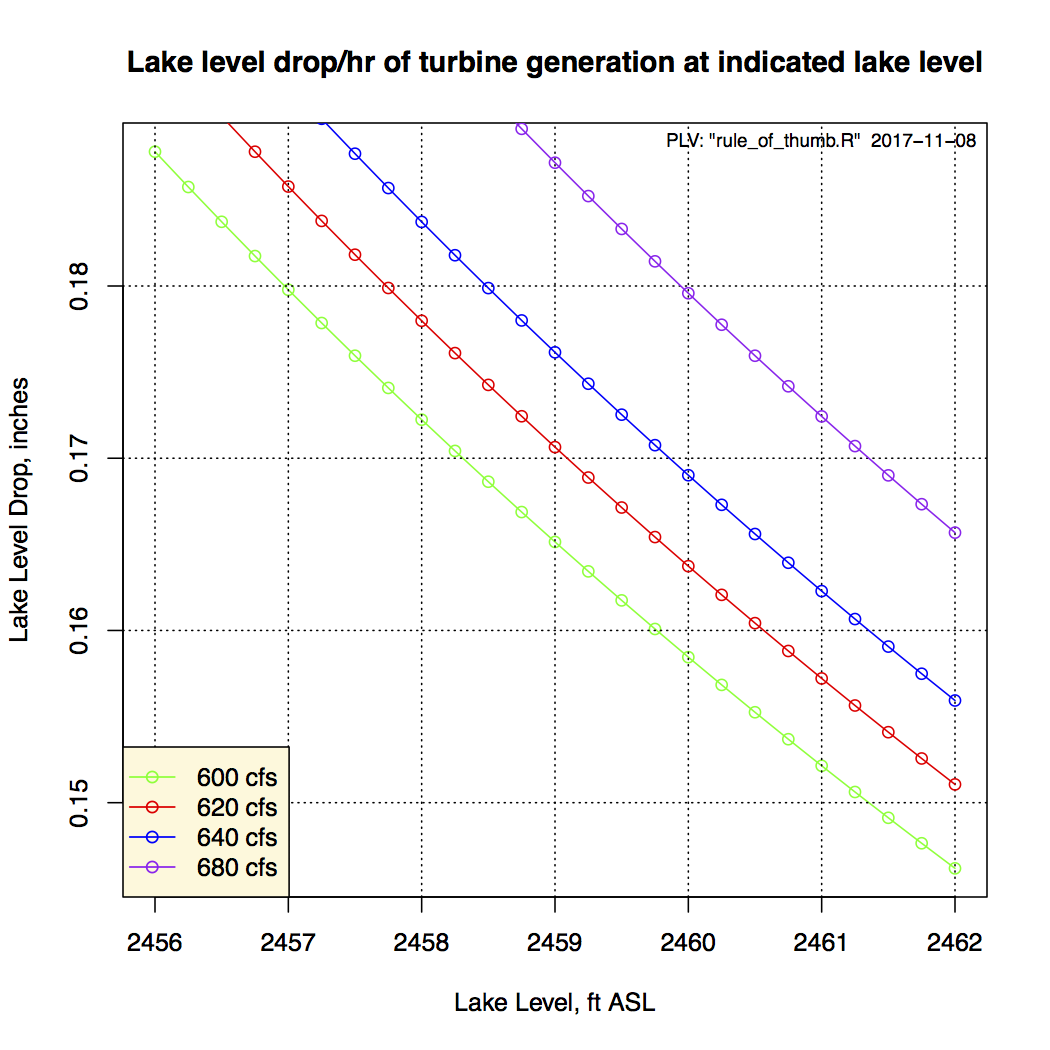
Figure 1. Lake Level Drop from Generators Running for One Hour at a Given Lake Level.
The graphs shows results for four assumed water consumption rates by the hydro-electric turbine systems as are reported in various reports. So at a lake level of 2459 ft, and assuming the highest water consumption rate (680 cfs), the generators must run for a total duration of 6 / 0.188 = 31.9 hours for the lake level to drop 6 inches.
2. Analysis
It’s important to understand that the amount of water available per unit lake level varies as a function of the surface area of the lake and hence the level of the lake. To determine how much the lake level drops per hour of water release through the hydroelectric turbine, it is important to have a relationship that determines the lake volume as a function of lake level. The literature reveals two such references for Deep Creek Lake, namely [a page from the FERC application]({{ < ref “/levels/graphs/rule_of_thumb/PENELECStage-Storage1963.pdf” > }}) (specific document unknown), and a data table in one of Penelec’s reports. As it turns out, the latter is a subset of the data of the former. A graph if this data is shown in Figure 2.
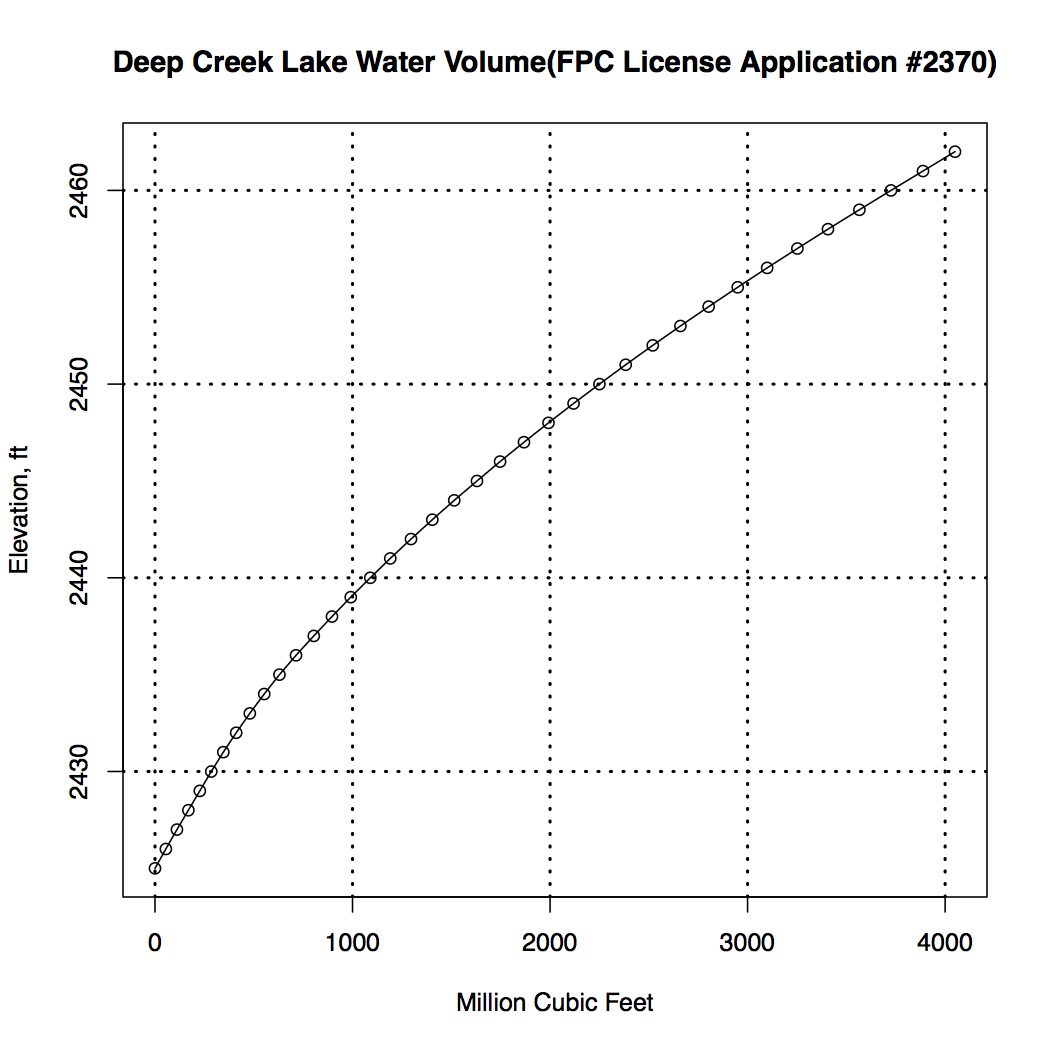
Figure 2. Lake Volume as a Function of Lake Level from FERC Application.
In 2012 DNR conducted an bathymetric project during which they collected an extensive set of data during April of that year. The author of this note has used the data to construct bathymetric maps for over 30 coves, and the lake as a whole. Part of this effort, a graph of surface area as a function of lake level and lake volume as a function of the lake level were created with this data. Since the volume of the water of the lake various as a function of lake level, one of the important relationships to determine is how that varies. Such data is typically generated from the water body’s bathymetry. From the DNR 2012 bathymetry data bathymetric was obtained the curve of available water volume and surface area as a function of lake level. Since only the water depths less than the lowest lower rule band value are of importance to power generation and lake level operating constraints, curve fits have been prepared for lake volume and lake area as a function of lake level. Only one of these curves is really needed in the analysis since the water level change for one hour of turbine generation can be measured in fractional inches. Figure 3 shows the data from the three sources discussed above.
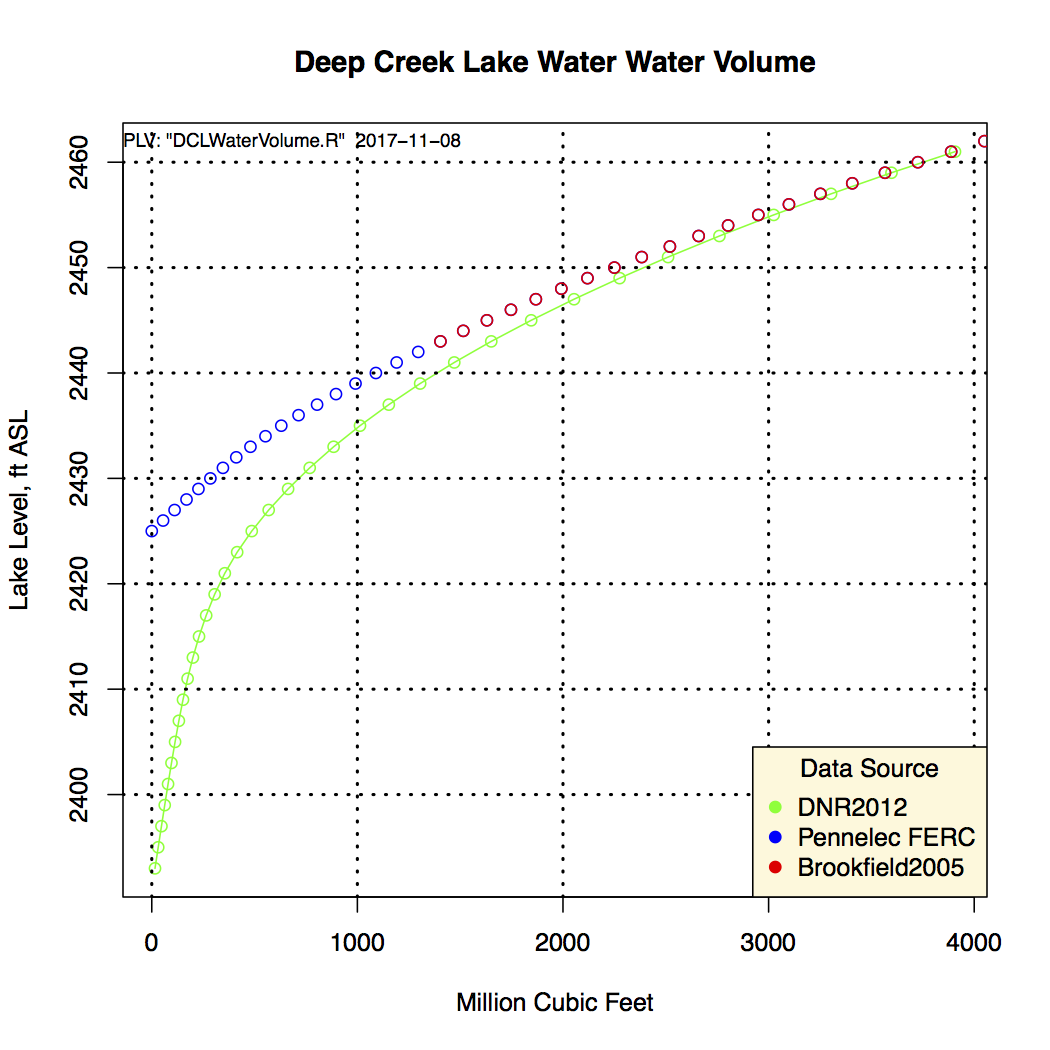
Figure 3. Lake Volume as a Function of Lake Level.
Or in terms of acre-feet, a more useful number, the lake volume is shown in Figure 4, together with other volume references.
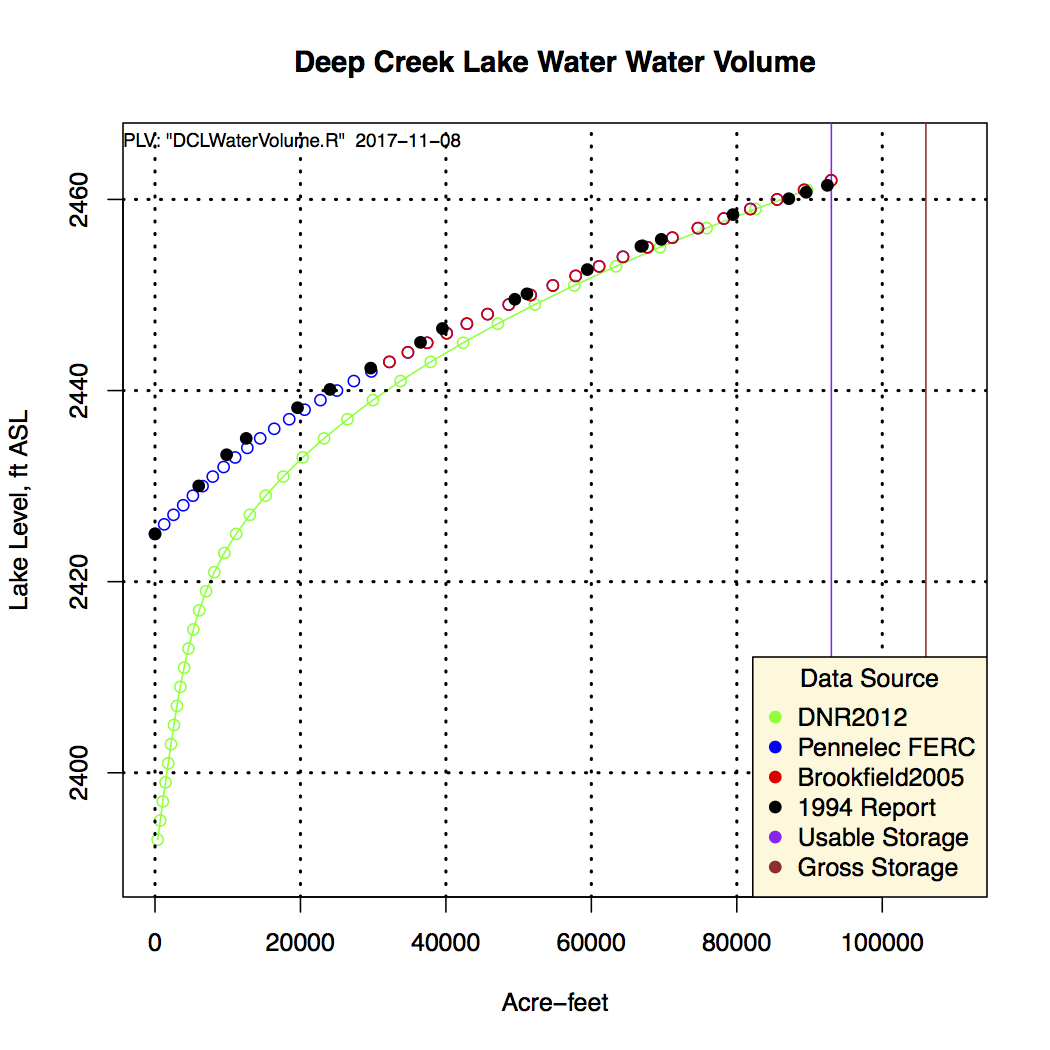
Figure 4. Lake Volume as a Function of Lake Level.
The validity of the new DNR2012 curve is reinforced by the statement in the [1994 characterization report, p.2-2]({{ < ref “/levels/graphs/rule_of_thumb/DeepCrSupportDocument-Rev1994Apr.pdf” > }}), showing a “Usable Storage” volume of 93,000 acre-feet. Also given is a “Gross Storage” volume of 106,000 acre-feet. It’s not clear what the difference is between these two values. The usable volume seems to align well with the volume of the reservoir at 2462 ft elevation, and the gross volume may be aligned with a 2466 level, something that was considered in the inital design of the lake by adding 4-ft high panels on top of the spillway, something that was actually never constructed. From that same ‘characterization’ report, Figure 2-8 was digitized and the data added to the plot and labeled as 1994 Report, close to the other Penelec data.
In addition, the literature is scavenged for the range of values of the ‘design flow’ of the turbines. From the characterization report, referenced above, p.2-12, a value of discharge of 320 cfs at 400 ft net head (hence 640 for both turbines) is listed. Comments are also provided about the impact of the operating ‘head’ on the design flow values; Marylands PPRP “The Deep Creek Project” web page lists a value of up to about 639 cfs discharge; (more to be added)
To generate the curves in Figure 1, one computes the amount of water extracted from the lake for an assumed value of the discharge from the turbines and considers the lake level drop at a specified lake level using the DNR2012 curve shown in Figure 4. To facilitate the calculations, the data from DNR2012 was fitted by a quadratic curve as shown in Figure 5.
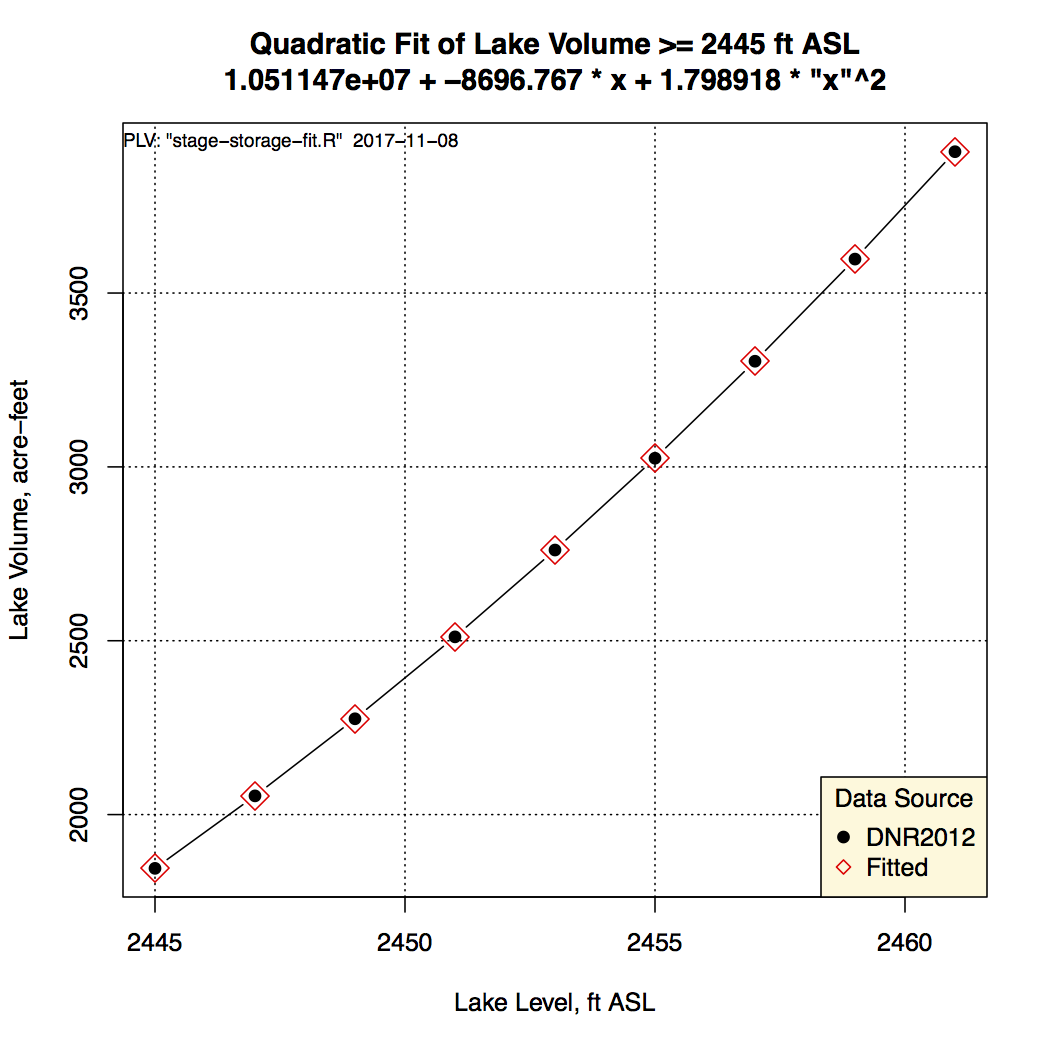
Figure 5. Quadratic Fit of Lake Volume as a Function of Lake Level.
First Published: 2017-11-05
Revised: 11/8/2017
Scripts associated with this effort [can be found here]({{ < ref “/levels/scripts/Stage-Storage2017.zip” > }})
Adapted for this website: 01/14/2018