Piet's Notes on Deep Creek Lake Science
Sensible Technologies - The Science of Deep Creek Lake
To analyze the performance of the Deep Creek Hydro Project two types of data are available to do so, lake level data and river gage data.
Lake level data contain information about when the hydroelectric turbines are operating or not, via a ON/OFF data field, while river gage data are obtained from the USGS web site who operate these gages, with river flow rate being the item of interest
By analyzing the combined data sets one can determine the amount of water released, the duration of the release, whether one or both turbines are operating, and whether the bypass flow is open or not and at what setting. The average speed of the water flowing downstream can also be determined.
Theoretically partial turbine speed can also be determined, but it appears that the turbines are operated either with full open or fully closed mode.
This paper describes how all these above can be done by example.
The data obtained by the USGS (US Geological Survey) river gages [1] can be used to understand the nature of the releases by the Deep Creek Hydro Project.
A release shows up at a downstream flow gage as a sudden increase in flow for a finite duration, the duration of the release.
The peak of the sudden increase in flow can be used to assess the amount of water that is flowing through the turbines. By looking at several gages downstream, the speed of the wave down the river can also be determined. This report attempts to understand and quantify these release characteristics.
Being able to read and process USGS river gages is important in understanding the releases made by the Deep Creek Hydro Project and the evaluation of the TER protocol.
The location of these gages are summarized in Table 1 with more detailed information in Appendix A.
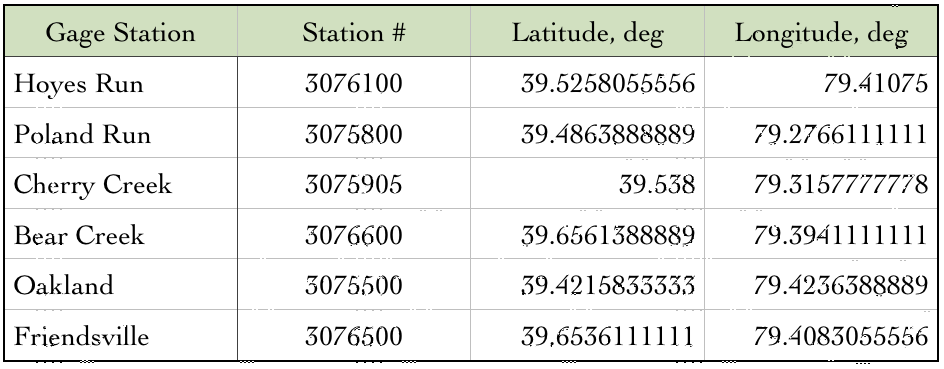
Table 1 - USGS Gages of Importance.
Hoyes Run is located close to the tail race of the Hydro Electric power plant, approximately 1/2 mile downstream. A typical record obtained from the USGS website is shown in Figure 1.
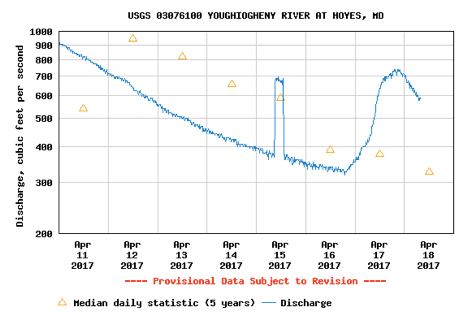
Figure 1 - A Typical Hoyes Run Record from the USGS Website.
Except for the spike on April 15, this is a typical output from the gage, showing a series of dry days, with the stream slowly loosing its flow, and rain coming into the stream starting at the end of April 16. The spike on April 15 is a discharge from the lake through the hydro-electric turbines. One can estimate the amount of water released by integrating the area under the spike. Unfortunately, the vertical axis is a log scale so that we cannot count just the ‘squares’ under the curve. But, the peak of the pulse is around 700 cfs, and the value on the base flow is about 370 cfs. The difference, 330 cfs is consistent with an operation of one of the two turbines (each turbine can accommodate about 320 cfs).
The magnitude of the pulse above the base flow is estimated to be 37.3 cfs, while the duration at the base is estimated at 4.45 hrs.
A typical full release through the turbines should produce a flow rate of about 640 cfs. Hence it can be concluded that this was not a release through the turbines.
This is more in line with the bypass flow that can be regulated. The development of its performance curve has been [described elsewhere] (http://senstech.com/dc_hydro/turbine_bypass_flow/). The bypass flow as a function of valve setting was derived from a linear regression of data reported in Brookfield’s annual reports to MDE and is:
Q = -13.8197 + 0.7215 x V
Q = bypass flow, cfs
V = valve setting, %
With Q at 37.3 cfs, the % valve setting is about 71%, something realistic.
Let’s pursue this a bit more.
Figure 2 shows the USGS readings at Hoyes Run for the period 3/1/2017 - 4/1/2017. The results are rather interesting.
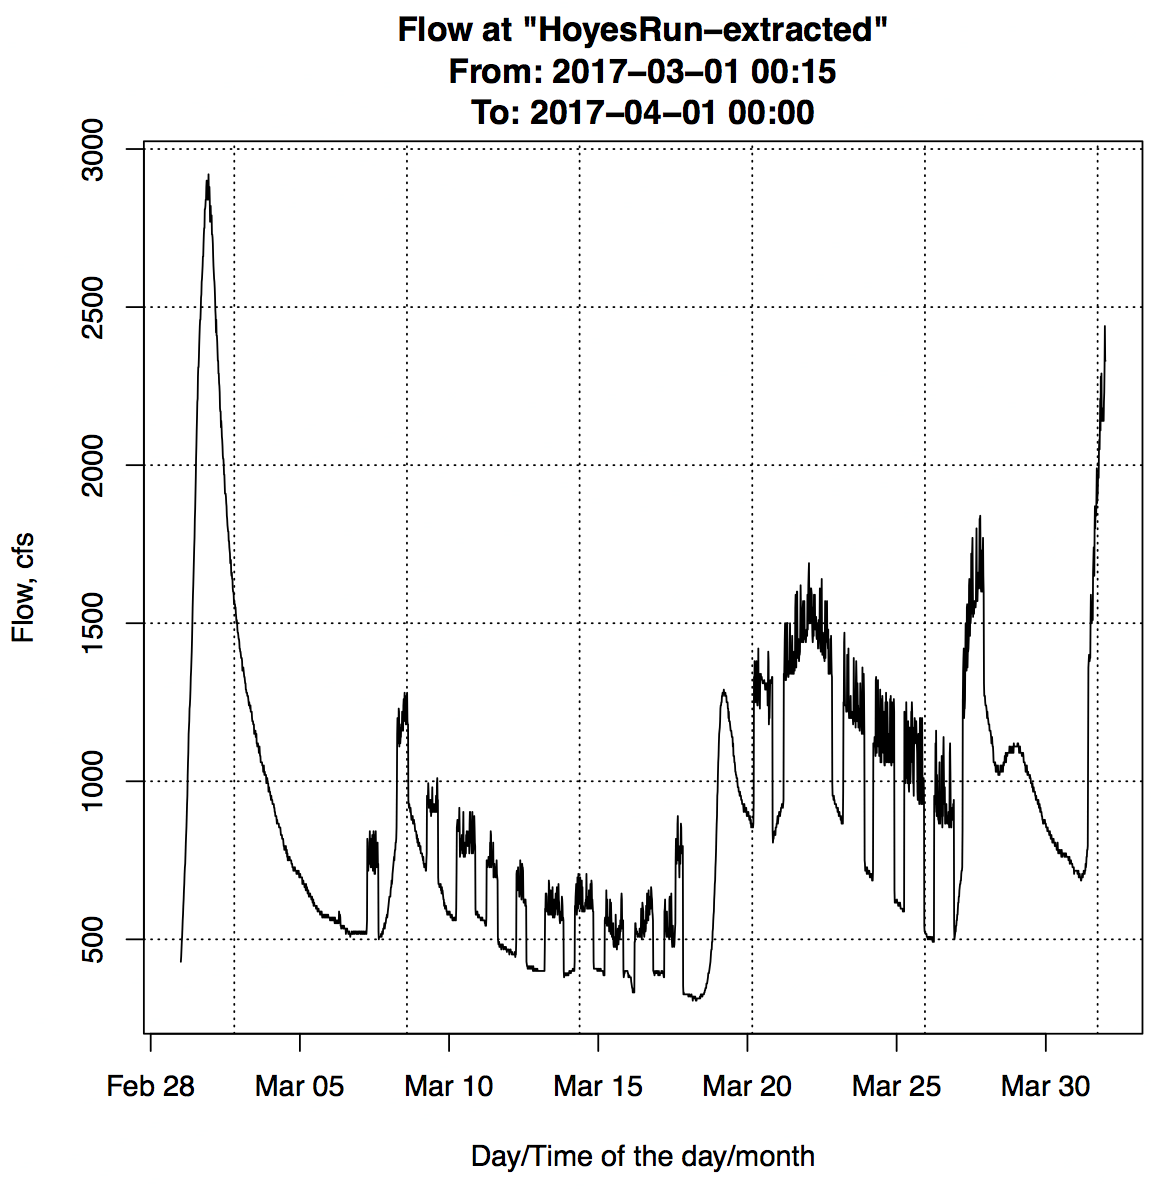
Figure 2 - USGS Readings at Hoyes Run From March 1 - April 1, 2017
The first thing to understand is that a single turbine produces a flow rate of about 320 cfs, and hence both turbines would produce a combined flow of about 640 cfs.
Looking at the period from around March 7 through March 17, the pulses are around 300 cfs above the base flow, suggesting a one-turbine operation condition. The pulses from March 20 through March 26, are around 600 cfs, suggesting two-turbine operation. This kind of information is not available from the lake level records published on Brookfield’s Deep Creek Hydro website.
Digging a little deeper, Figure 3 looks at the data from10-15 March 2017.
Here it is much clearer that the maximum flow rates are about 230 cfs and that the last two shown are about 15 hr releases. The other durations are smaller.
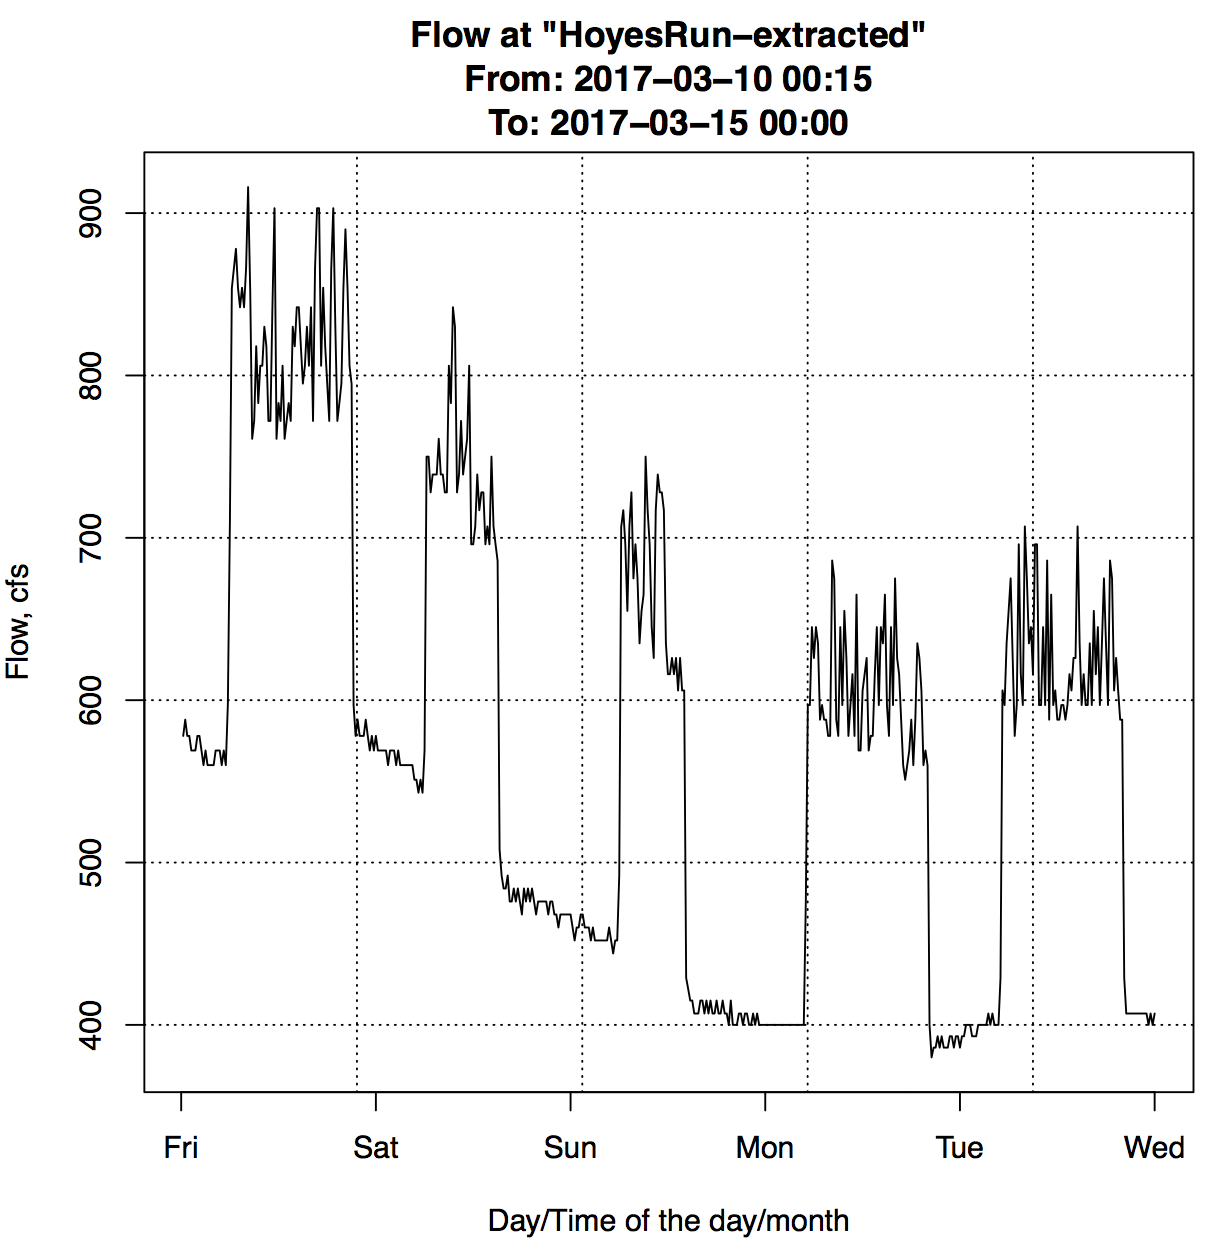
Figure 3. USGS Hoyes Run from March 10, 2017 - March 15, 2017.
Let’s now look at the period March21-March 25, 1917, as shown in Figure 4.
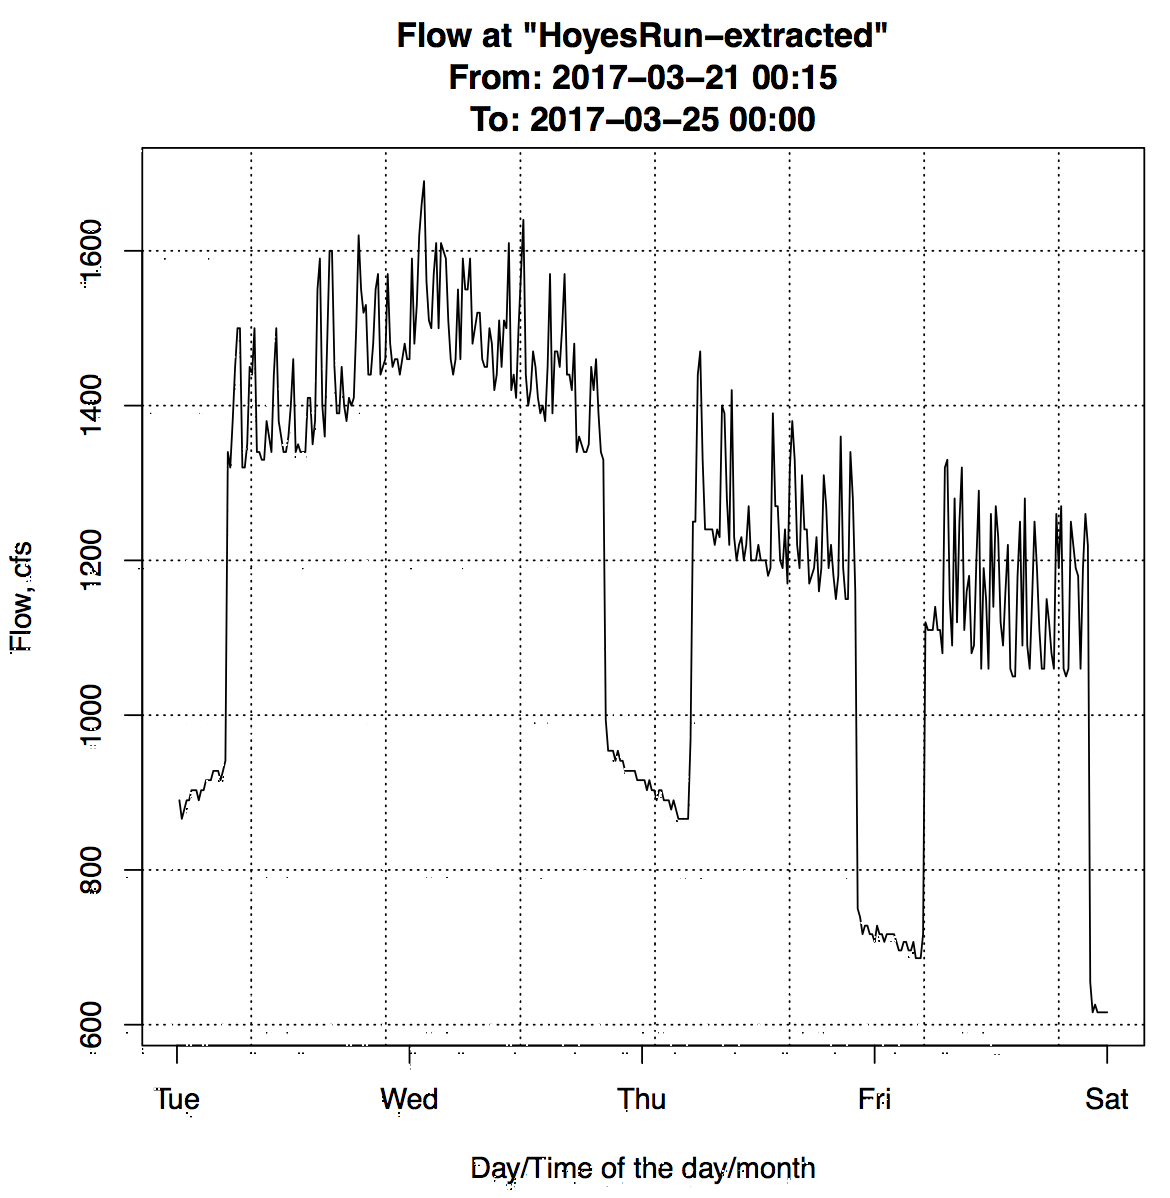
Figure 4 - USGS Flow at Hoyes Run from March 21, 2017 - March 25, 2017.
The noise at the top of the pulse is probably turbulence because the gage is not too far from the hydro electric stations tailrace, about 1/2 mile. These pulse heights could be interpreted as being around 600+ cfs, and hence two-turbine operation.
Another graph of interest is comparing the flow between two locations.
Figure 5 shows the flows over a certain time span, as shown in the label, at Hoyes Run and Friendsville. From the graph one can estimate the time of travel of the wave by computing the displacement of the wave along the x-axis. Here it is approximately 3.2 hrs.
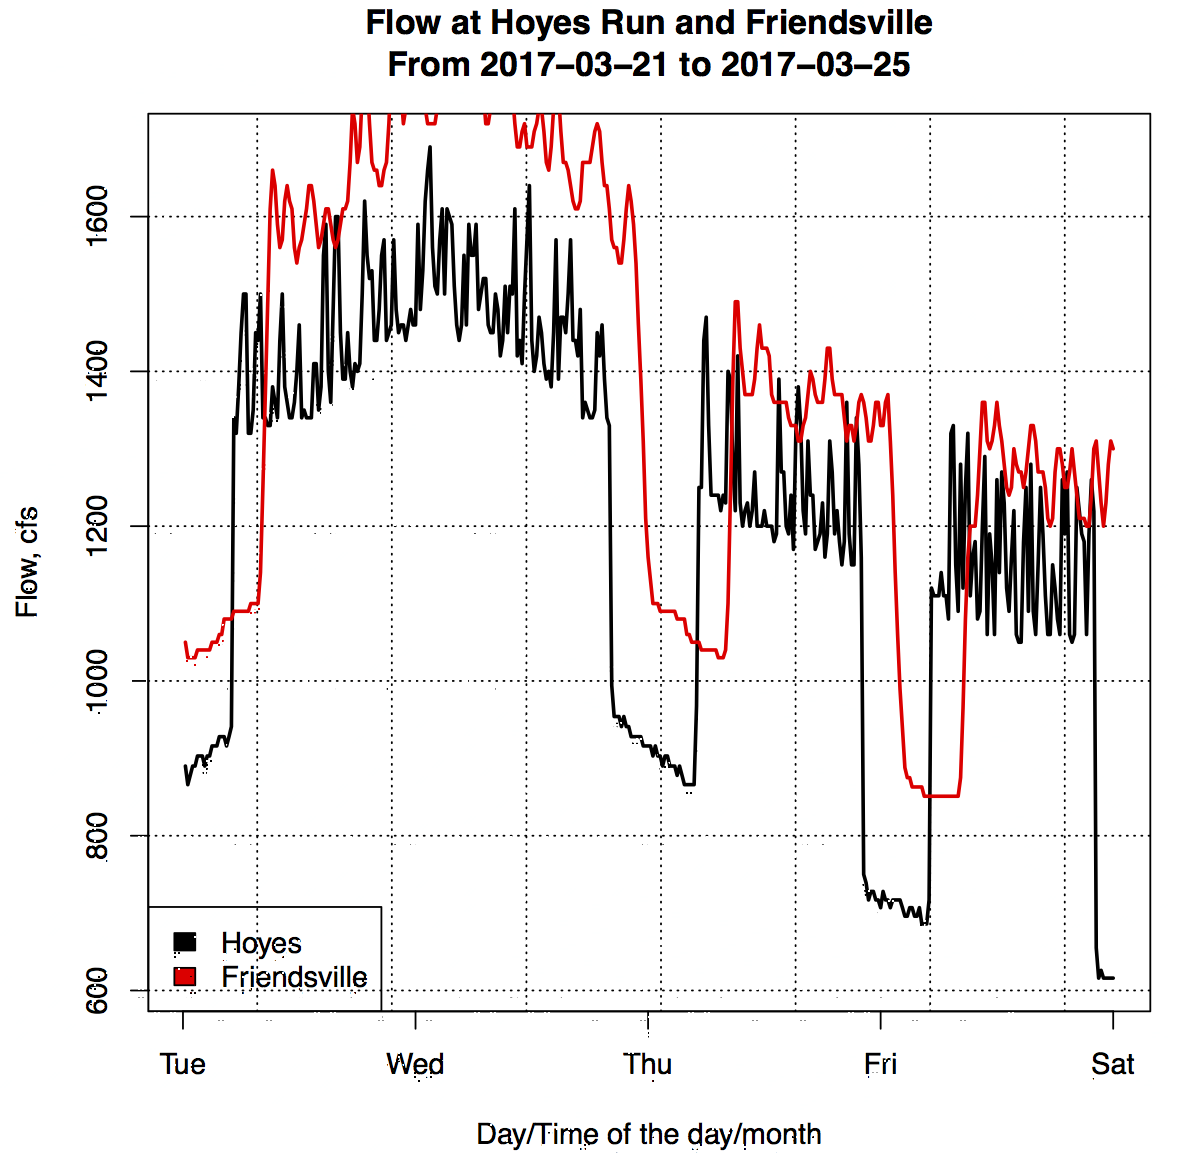
Figure 5 - Flows at Hoyes Run and Friendsville.
The changes in the y-axis values reflects the additional water coming into the river from groundwater, runoff and creeks.
To validate some of this we need to look at the lake level gage readings to get a better feel for turbine operation. This is discussed in the next section.
Lake levels are reported on the Deep Creek Hydro website as a real-time measurement [2]. The data provided are:
1. Generator Status ON/OFF
2. Last Reading of Lake Level
3. Current Lake Level (ft ASL)
4. Last Status Change (Generator Status)
Data are only available as a point measurement from the website.
An automated webpage ‘scraping’ method has been developed by the author of this note and has operated it continuously to retrieve these point measurements from the web page every 10 minutes. This procedure is resulting, so far, into a fairly complete data set for 2017 so far (4/1/2017). Periods in the past are sporadic and will be discussed and analyzed in a separate report.
For now, let’s look at this data for the same period as in Figure 5.
This is shown in Figure 6, above, where the individual lake level data points are plotted against time, together with a smoothed fit (Loess’ smoothing) of this data, and the operation of the turbine marked in dark blue. Comparing it with Figure 7 one can see the operation of the turbines matching pretty well.
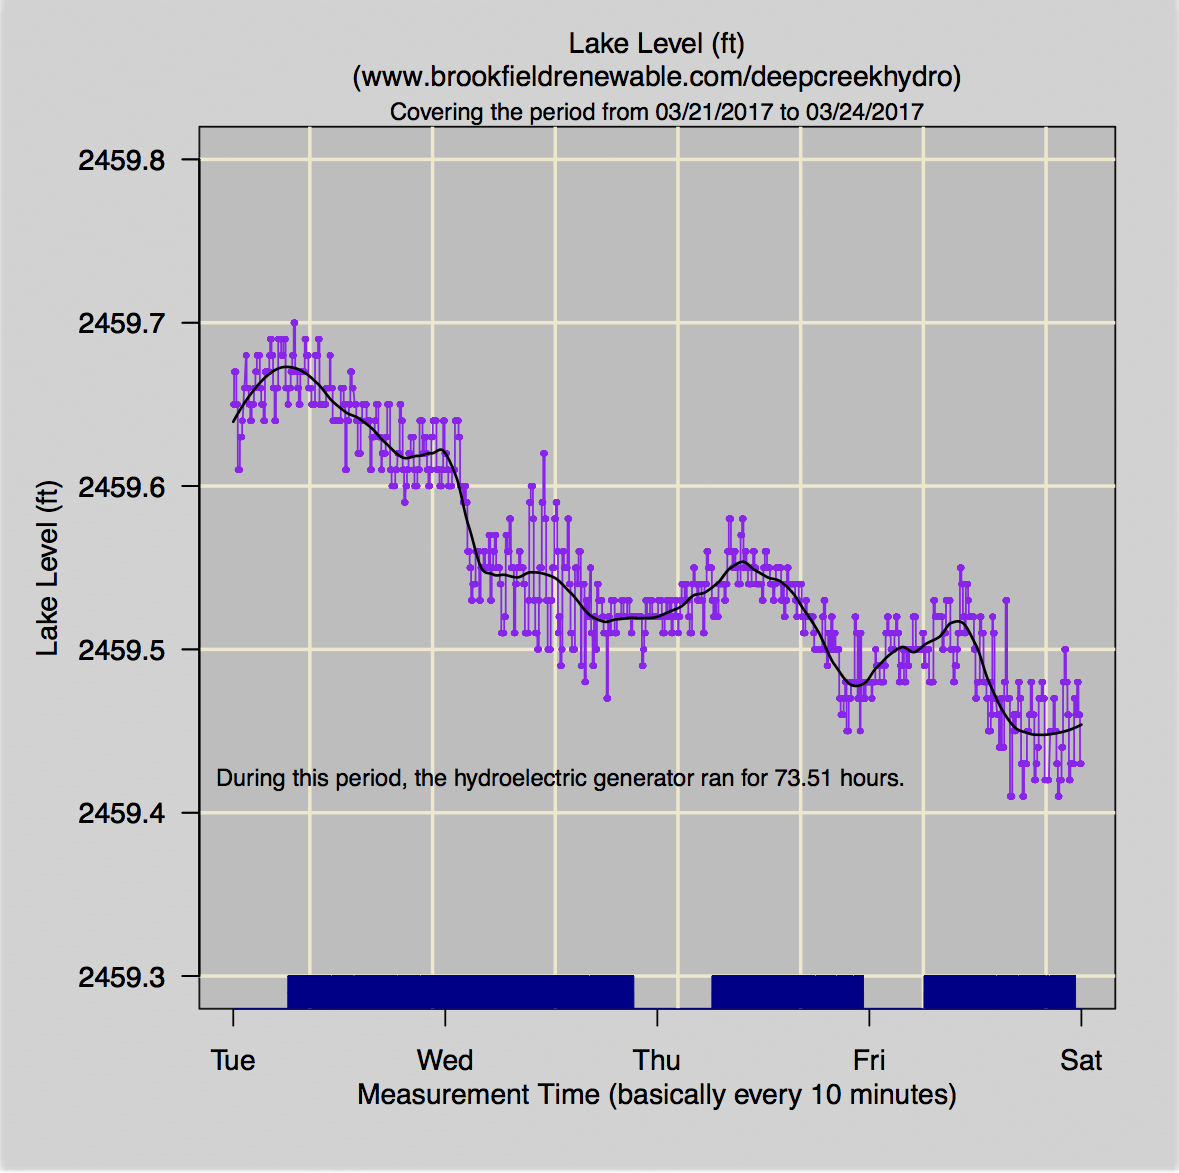
Figure 6 - Lake Levels and Generator Operation.
Combining the Lake Level Gage Data and USGS Gage Data The next visual is to superimpose both sets of data onto one graph. This is done in Figure 7.
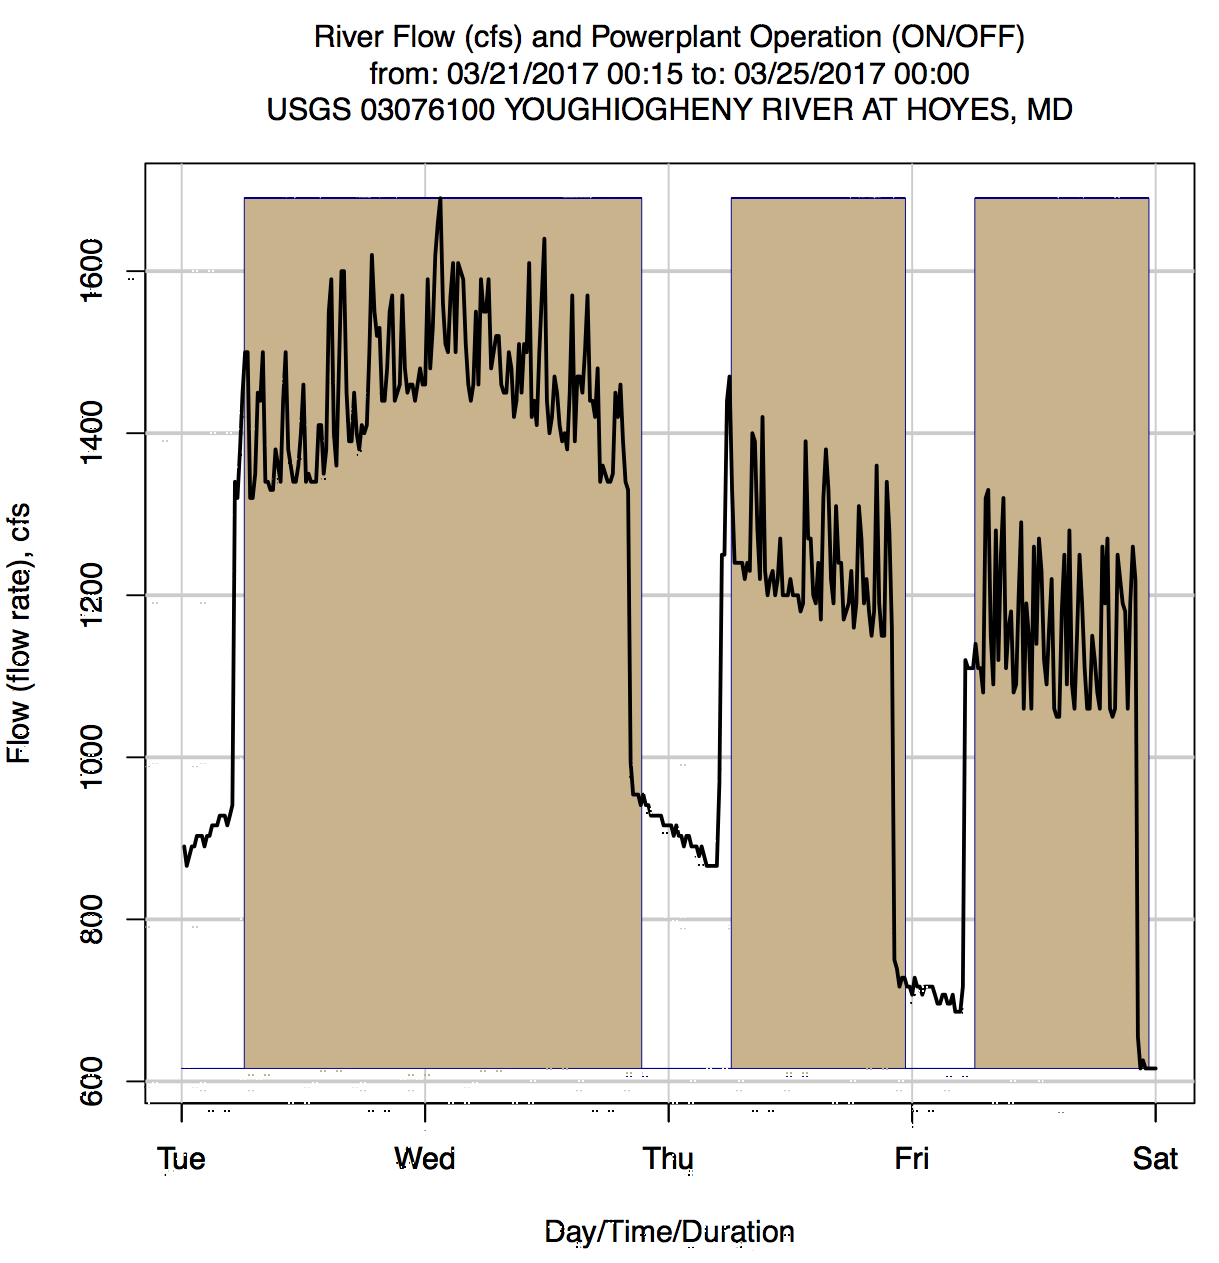
Figure 7 - Combine Lake Level Data and USGS Data
There is a slight offset noted along the x-axis between the ON/OFF times of the lake level gage, measured by Brookfield, and the measurement by the USGS gage. The USGS gages list their times as Eastern Standard Time (EST), while Brookfield’s data are in Eastern Daylight Time (EDT).
Correcting the difference and putting all data in EDT is not a trivial exercise to automate and will be left to a later time. Suffice it to say that the time difference is 1 hr, and is consistent with the fact that during the interval of this data the ON/OFF values should be shifted one hour earlier. Correcting for this difference will match the two data types.
By combining the USGS gage readings with the lake level measurements made by Brookfield, one can ascertain with a great degree of certainty how the turbine facility is operated. This cannot be done with the lake level measurements alone. Looking at the river flows provides insights as to the release strategies Brookfield uses which are not discussed anywhere.
The various operating modes are bypass flow, one turbine operation and two turbine operation and their respective durations. Tallying such data throughout the year provides an estimate as to the total quantity of water realized from the lake. Note that this says nothing about the leakage through the wicket gates, which is 24x7x52 and which cannot be ascertained without a special, not difficult to do, measurement in the tail race. One can also determine the travel speed of the wave created by the release.
1. https://waterdata.usgs.gov/usa/nwis/uv?03076100 [Accessed 4/18/2017]
2. https://renewableops.brookfield.com/en/Presence/North-America/Recreation-and-Safety/Deep-Creek-Hydro/Lake-Levels [Accessed 4/18/2017]
The following USGS stations are of interest to this study. The data were obtained from the pertinent USGS websites.
1. Station #03076100 = YOUGHIOGHENY RIVER AT HOYES RUN, MD (hoyes) - LOCATION.–Lat 39°31'32.9", long 79°24'38.7", referenced to North American Datum of 1983, Garrett County, MD, Hydrologic Unit 05020006, on right bank 0.2 mi upstream of Hoyes Run, and 3.5 mi upstream from bridge on Sang Run Road. - Discharge and Gage Height both from 2011-07-29 to present
2. Station #03075800 = POLAND RUN NEAR SWANTON, MD (poland) —– NOTE: This gage has been taken out of service as of 6/14/2013 - LOCATION.–Lat 39°29'11.1", long 79°16'35.8", Garrett County, Hydrologic Unit 05020006, on right bank, 3.0 mi northwest of Swanton, 4.6 mi northeast of Deer Park, 3.6 mi southeast of Thayerville, and approximately 400 ft upstream of confluence with Deep Creek Lake - A variety of parameters including discharge and temperature. Check the website - records from 2007-10-01 through 2008-09-30. While no longer in service, this gage has all kinds of other measurements, possibly important to Deep Creek Lake, since it flows directly into the lake.
3. Station #03075905 = CHERRY CREEK AT STATE PARK ROAD NEAR MCHENRY, MD (cherrycreek) - LOCATION.–Lat 39°32'16.8", long 79°18'56.8", Garrett County, Hydrologic Unit 05020006, on right bank, 3.0 mi southeast of McHenry, 3.2 mi northeast of Thayerville, and 0.15 mi upstream of confluence with Deep Creek Lake. - Discharge and Gage Height both from 2007-10-01 to present.
4. Station #03076600 = BEAR CREEK AT FRIENDSVILLE, MD (friendsville)LOCATION.–Lat 39°39'22.1", long 79°23'38.8", Garrett County, Hydrologic Unit 05020006, on right bank 0.2 mi downstream from bridge on Accident-Friendsville Road, 0.6 mi downstream from South Branch Bear Creek, 0.8 mi southeast of Friendsville, and 1.2 mi upstream from mouth - Discharge and Gage Height both from 2007-10-01 to present
5. Station #03075500 = YOUGHIOGHENY RIVER NEAR OAKLAND, MD (oakland) - LOCATION.–Lat 39°25'17.7", long 79°25'25.1", Garrett County, Hydrologic Unit 05020006, on left bank 200 ft downstream from Baltimore and Ohio Railroad bridge, 250 ft downstream from Little Youghiogheny River, 1.2 mi northwest of Oakland, and 1.5 mi upstream from Dunkard Lick Run - Discharge from 1941-08-26
6. Station #03076500 = YOUGHIOGHENY RIVER AT FRIENDSVILLE, MD ,LOCATION.—Lat 39°39'13.0", long 79°24'29.9", Garrett County, Hydrologic Unit 05020006, on left bank 0.7 mi upstream from bridge on State Highway 42 at Friendsville, and 1.5 mi upstream from Bear Creek.
ASL = Above Sea Level
Change from EST to EDT: “On the second Sunday in March, at 2:00 a.m. EST, clocks are advanced to 3:00 a.m. EDT leaving a one-hour “gap”. On the first Sunday in November, at 2:00 a.m. EDT, clocks are moved back to 1:00 a.m. EST, thus ‘duplicating’ one hour.”