Piet's Notes on Deep Creek Lake Science
Sensible Technologies - The Science of Deep Creek Lake
In surveying a problem often arises where one has the length of the distances between three points, or the coordinates of these three points, and the interest is in finding the center and radius of the circle that goes through these points.
This problem and its solution have been around a long time, but actual functions that solve this problem are not that prominent, and when checking the literature, often in error and incomplete, although the process described is valid
This note describes a ‘R’ function that accomplishes this task.
Figure 1 is an illustration of the problem. Three points defined by the Northings and Eastings of the points. Of interest is the radius and center of the circle on which the points fall.
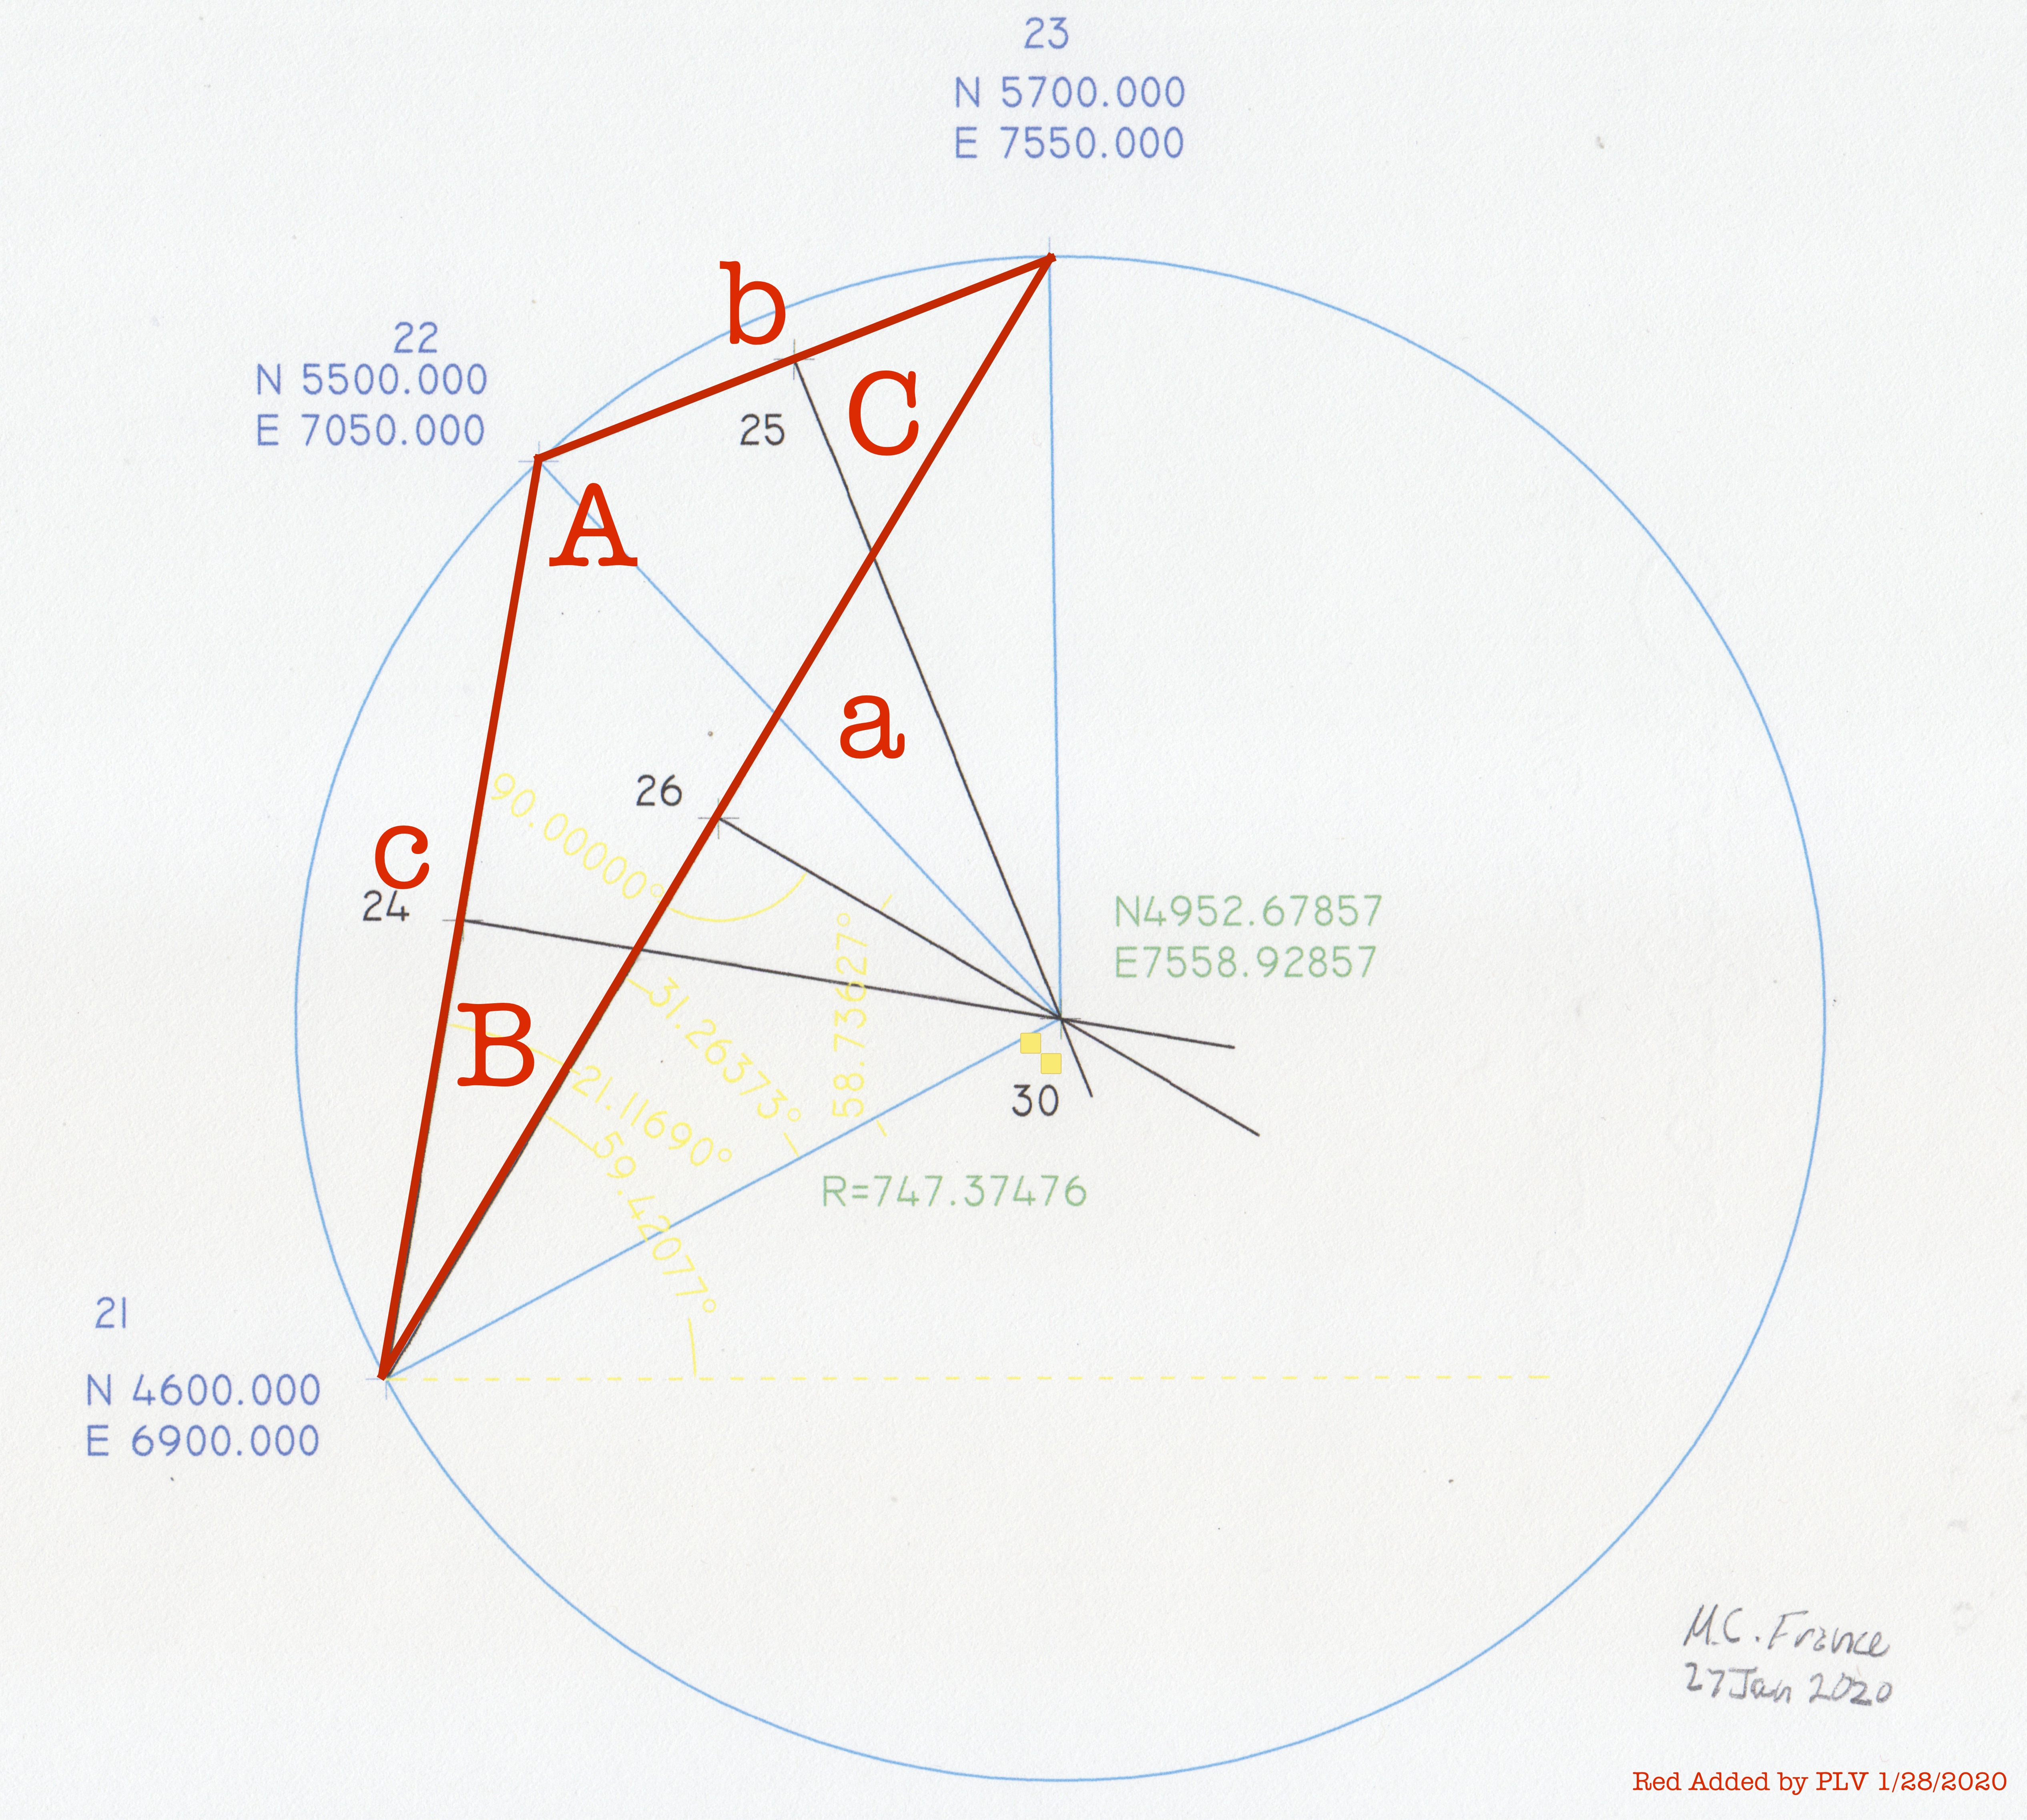
Figure 1 - Problem Definition
The following are some references that describe the problem and provide explicit solutions.
1. Get the equation of a circle when given 3 points
2. Circle Defined by 3 Points Calculator
3. 3 point to circle. And get radius [duplicate]
4. Equation of circle when three points on the circle are given - This reference lists code for C++, Java, Python and C#.
5. Finding Equation, Circle - Given 3 Points
6. How to find a circle passing through 3 given points
7. Circumcircle of a triangle This will give the radius only. Formula questionable.
8. Equation for a circle given 3 points A solution with Excel.
9. Tutorial on Equation of Circle See ‘Example 5’.
I used the points and results from Reference 4 above to check my implementation. My implementation is based on Reference 3 above.
Here is the implementation in R:
prob <- 3 #Sample Problem 3
xpoints <- c(6900, 7050, 7550)
ypoints <- c(4600, 5500, 5700)

print("x coordinates")
xpoints
print("y coordinates")
ypoints

# All plots will be collected in this pdf file
pdf(paste("../results/circle_", prob, ".pdf", sep=""), onefile=TRUE)


#========1=========2=========3=========4=========5=========6=========7=========8=========9=========0

# xpoints are the x coordinates of the three points
# ypoints are the y coordinates of the three points

threePointToCircle  <- function(xpoints, ypoints){

    x1 <- xpoints[1]
    x2 <- xpoints[2]
    x3 <- xpoints[3]

    y1 <- ypoints[1]
    y2 <- ypoints[2]
    y3 <- ypoints[3]

    dx2 <- x2 - x1
    dx3 <- x3 - x1
    dy2 <- y2 - y1
    dy3 <- y3 - y1

    xtop <- dx2 * dx2 * dy3 - dx3 * dx3 * dy2 + dy2 * dy2 * dy3 - dy3 * dy3 * dy2
    xbot <- 2.0 * (dx2 * dy3 - dx3 * dy2)

    xc <- x1 + xtop / xbot


    ytop <- dx2 * dx2 * dx3 - dx3 * dx3 * dx2 + dy2 * dy2 * dx3 - dy3 * dy3 * dx2
    ybot <- 2.0 * (dx3 * dy2 - dx2 * dy3)

    yc <- y1 + ytop / ybot

    xx <- xc - x1
    yy <- yc - y1

    r <- sqrt(xx * xx + yy * yy)

    return(c(xc, yc, r))
}


#========1=========2=========3=========4=========5=========6=========7=========8=========9=========0
# Calling the function with the data and returning the results in a vector 'z'

z <- threePointToCircle(xpoints, ypoints)
print('Center-x, Center-y, Radius')
z
xc <- z[1]
yc <- z[2]
radius <- z[3]
And here is the sample problem and solution.
"x coordinates"
[1] 1 2 5
[1] "y coordinates"
[1] 1 4 3
[1] "Center-x, Center-y, Radius"
[1] 3.000000 2.000000 2.236068
[1] "Echo check of points being on the circle"
[1] 2.236068
[1] 2.236068
[1] 2.236068
To verify the result I decided that I needed to plot the cicle and place the data points on the graph.
That turned out to be trickier than I thought. Check Figure 2 and Figure 3.
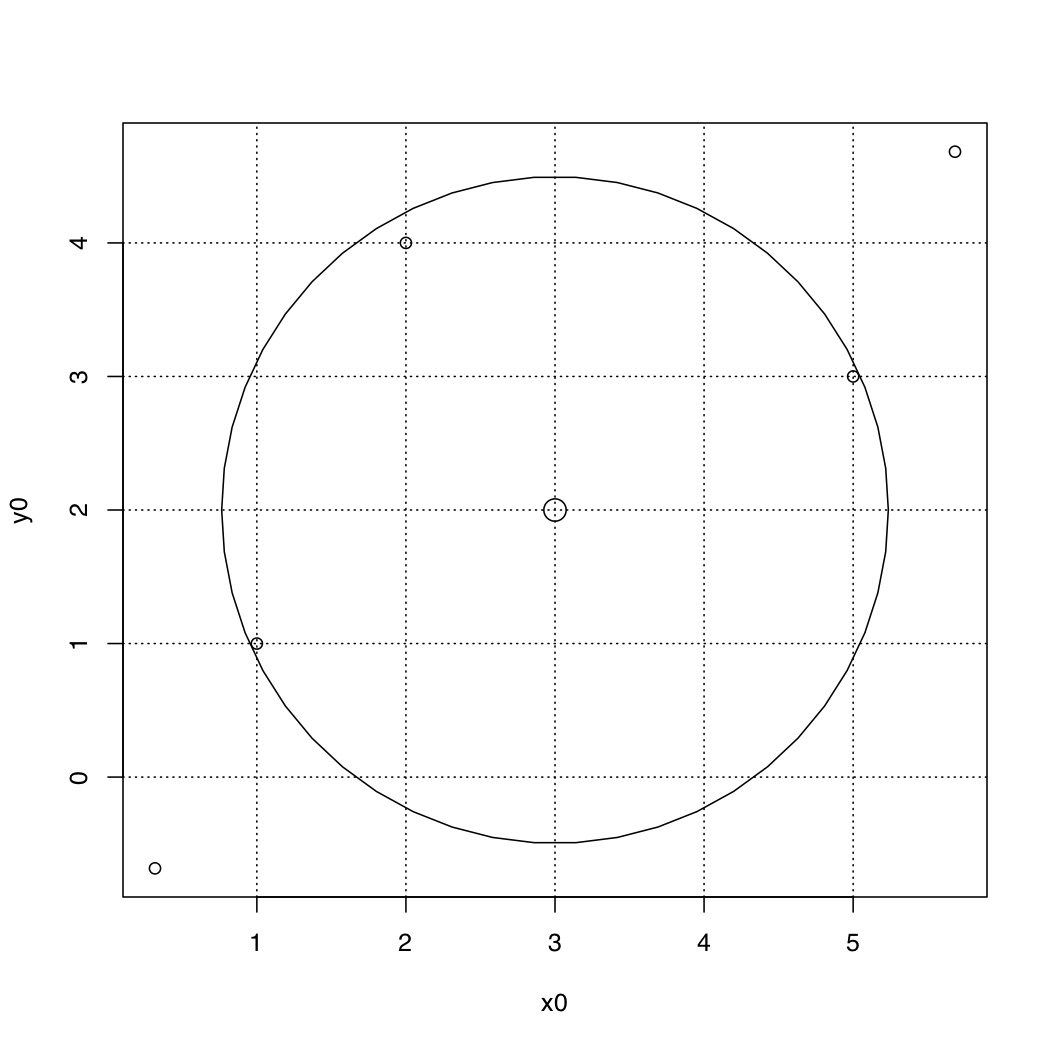
Figure 2 - Using R's Circle Function
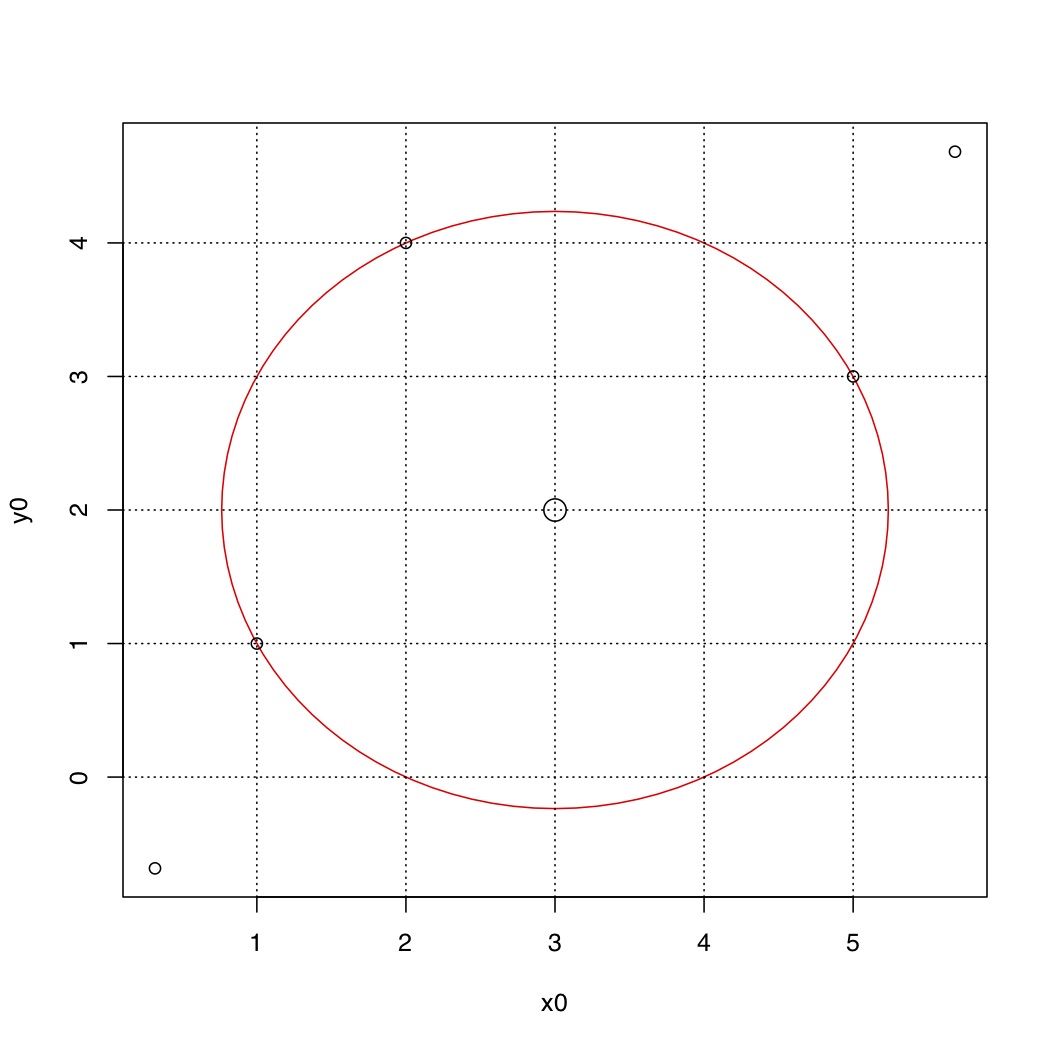
Figure 3 - Circle Build from Basics
Figure 1 uses a R function called ‘draw.circle(…)’ The points from the lines do not fall on the circle!?! For a while I thought I had implemented the algorithm incorrectly. So I calculate the distance from the center of the circle to each of the three points, and the result were all the radius, as one would have expected, as shown above. in the summary of the results.
So there is something wrong with the graphing. I haven’t resolved that issue entirely, except that it looks like two difference reference systems are used. So I create my own circle and bypass using the R function. Using the radius and the sine and cosines of the radius and the location of the center points I created a series of points and connected them by lines. The result is Figure 2, with the points on the circle, and the circle having a little squashed look, reenforcing my concerns about a reference system.
The above was all for the test problem. The real result of interest, Figure 1, is shown in Figure 4 and the following output:
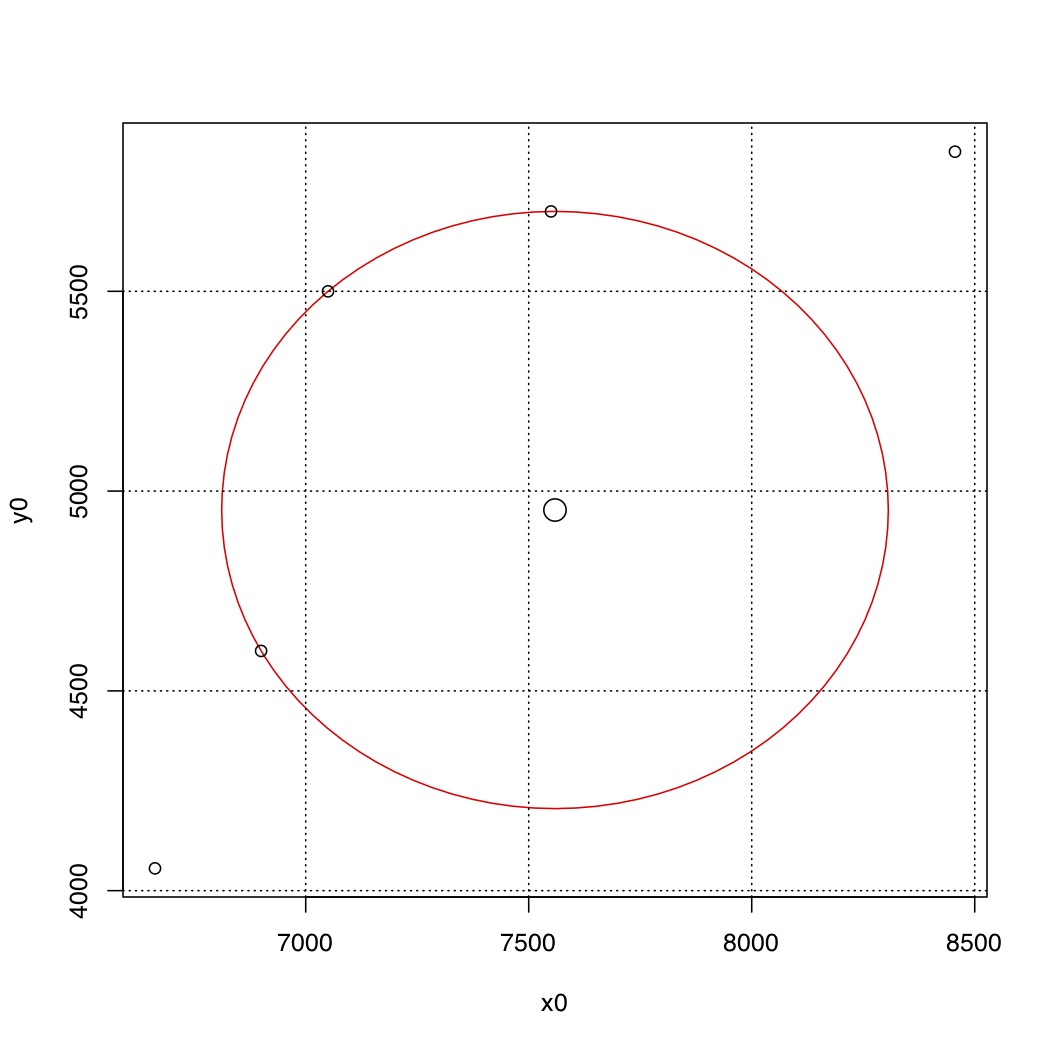
Figure 4 - Problem Result Verification
[1] "Sample Problem # 3"
[1] "x coordinates"
[1] 6900 7050 7550
[1] "y coordinates"
[1] 4600 5500 5700
[1] "Center-x, Center-y, Radius"
[1] 7558.9286 4952.6786  747.3748
[1] "Echo check of points being on the circle"
[1] 747.3748
[1] 747.3748
[1] 747.3748
[1] "Compute the lengths of the three sides of the triangle"
[1] "x coordinates"
[1] 6900 7050 7550
[1] "y coordinates"
[1] 4600 5500 5700
[1] "lengths <- c(912.4144, 538.5165, 1277.6932)"
End of story.
Pete Versteegen
First Published: 1/28/2020
NOTE: The script that contains all of the code can be downloaded from here.