Piet's Notes on Deep Creek Lake Science
Sensible Technologies - The Science of Deep Creek Lake
There is a lot of talk about Brookfield violating the lower rule band. This note examines these presumed violations by plotting the daily deviations from the lower band rule for the years 1994, the start of the permit conditions, to 2016.
Plots were generated for the number of inches of lake water level above or below the rule band for the years 1994 - 2016. The data files containing the lake levels and rule band band values can be found here. Scripts were developed to plot the difference between the daily lake level and the rule band value and cycled through all the years.
The results of the deviations from the lower rule band are shown in Figures 1 - 3.
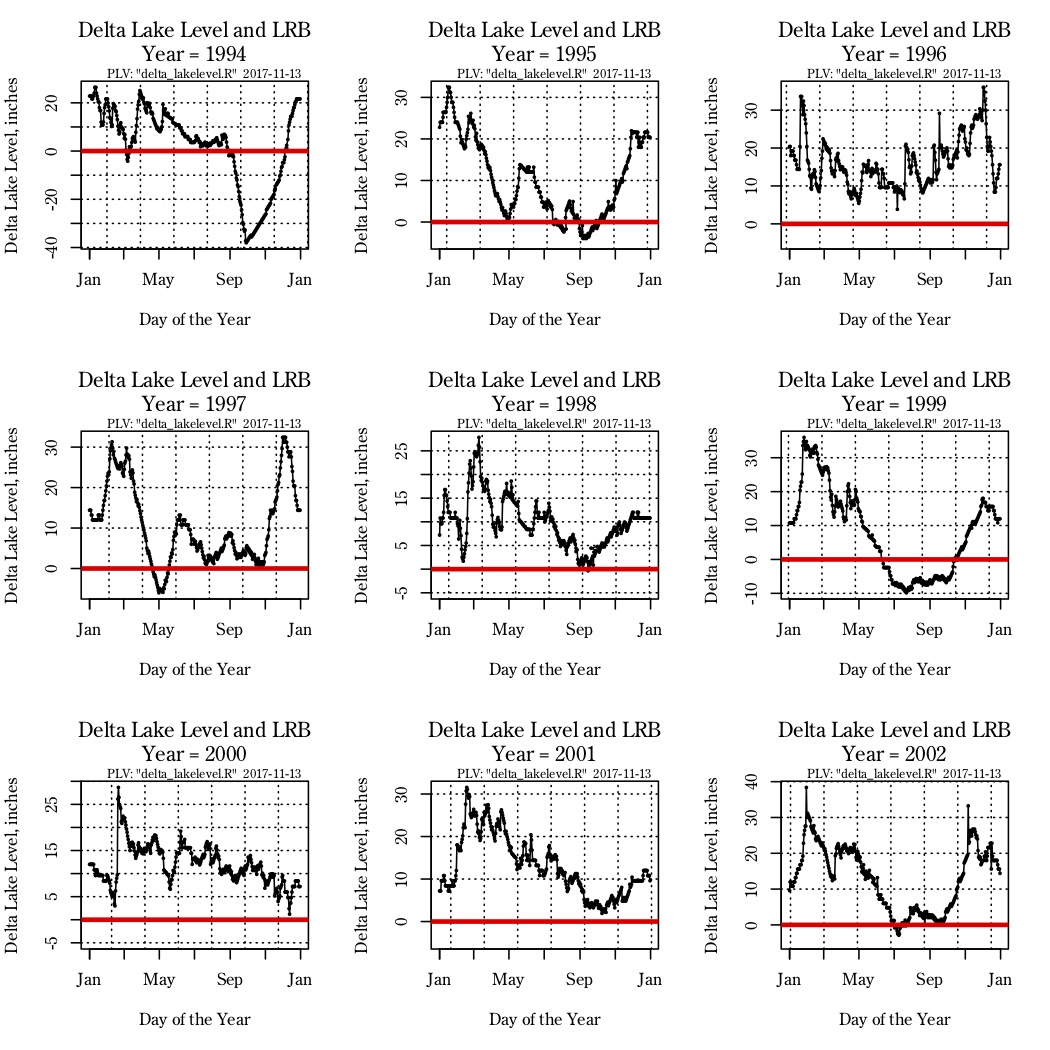
Figure 1. Delta Lake Levels for 1994 - 2002
Figure 2. Delta Lake Levels for 2003 - 2011
Figure 3. Delta Lake Levels for 2012 - 2016
These plots can be downloaded, as pdf files, using the links below.
1. Years 1994 - 2002
2. Years 2003 - 2011
3. Years 2012 - 2016
Examining these plots, the deviations occurred in the following years:
1994 - end of season; probably repairs; probable impact
1995 - during and at end of season; probably minimal impact
1997 - beginning of season; probably minimal impact
1999 - most of the season; almost 1 ft below LRB; significant impact
2002 - small blip early July; LRB high, probably small impact
2006 - early season; probably little impact
2007 - after season; no impact
2009 - before season; probably minimal impact
2010 - before season; end of season; probably minimal impact
2012 - mid and late season; a few inches at most; should have minimal impact
2016 - late season; should have no impact
When looking at the whole, the year(s) with significant violations that would probably matter are in 1994 and 1999, just two years. Please take note of the size of the y-axis intervals.
Perhaps boats got stranded or had to be pulled out early, but that was NOT because Brookfield did not abide by the LRB. The citizenry did not do their due diligence to know how deep the waters are at the location of their boat slip.