Piet's Notes on Deep Creek Lake Science
Sensible Technologies - The Science of Deep Creek Lake
This is a follow up to a post on lake level data smoothing written a number of years ago, in 2012.
Lake level measurements have a tendency to fluctuate up and down, and an early attempt to investigate these changes concluded that there was a natural sloshing of the waters from one end of the lake to the other. It was guessed that this was due to winds flowing over the lake. No serious analysis was done, except to observe that the lake was possibly sloshing and that the amplitude was small.
R has an extensive set of methodologies to smooth data which can possibly reveal more of the periodicity of the lake levels. This post reanalyzes the phenomenon with data collected in recent weeks (January 2018) on lake level measurements and analyzes this with various smoothing methods. These methods are:
This note presents results of each of these smoothers for parameters that control the smooth function being used.
The data set used is from January 18, 2018 starting at 12:34:58 am and ending January 26, 2018 at 12:27:35 am. The collection interval for the measurements is about every 10 minutes. The data set can be downloaded from here.. The file contains three columns of data: ‘Datetime’ is the date (year-month-day) and time (hr:min:sec) the measurement was ‘harvested’ from the Deep Creek Hydro website, ‘ONOFF’ is the status of the generator system, either ON or OFF and the third column is the ’lake level’ in ft ‘Above Mean Sea Level.’’
Figure 1a is a plot of the the raw data. The oscillations in the measurements are clearly seen. Some are generator induced, drawdown and recharge from groundwater, and some are due to the uncertainty in the gage resolution. It is somewhat desired, at least by me, to understand where those oscillations come from, whether inherent noise, water removal or addition to the lake, or some other phenomena. On the Feb 2012 post, referenced above, it was assessed that the water fluctuations was from the waters sloshing back and forth. The lake is a large body of water, and the sloshing would be difficult to stop because of its inertia and the forces on the water bodythat are in play to make it happen, particulalry the wind.
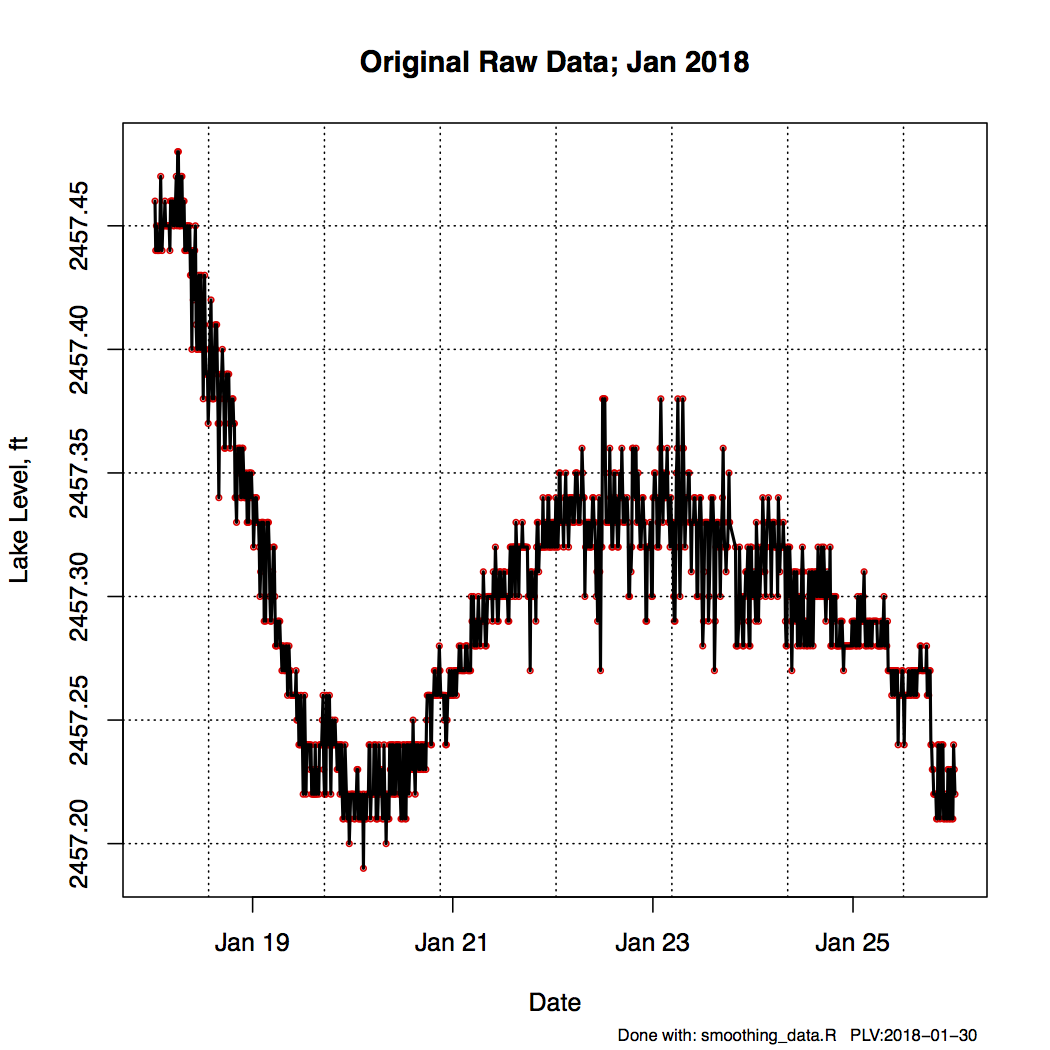
Figure 1a. As Recorded Lake Level Data for the Period Investigated.
Figure 1b superimposes the status of the generator and the number of hours they ran. The one thing that cannot be determined from the data retrieved from the Deep Creek Hydro website is whether the generators were always running at their design conditions. In all of the work reported here, it is assumed that they were (In another blog post I can demonstrate that one can get a pretty idea whether the generators are running at part speed by looking at the USGS flow gages in the Youghiogheny River). As noted above, the generators draw down the lake a small amount relative to the lake volume, clearly depending on how long they operate continuously, of which some is recovered by inflow of ground water.
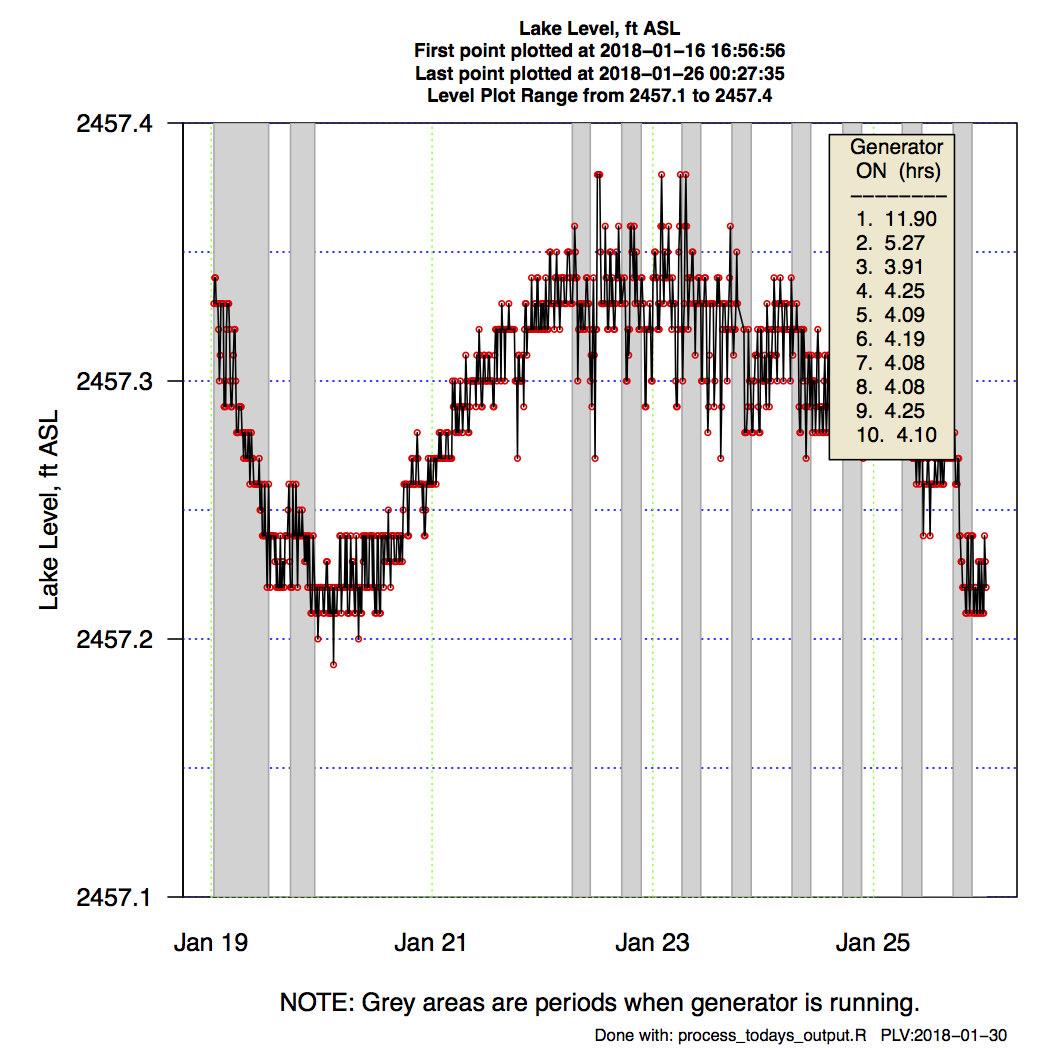
Figure 1b. As Recorded Lake Level Data for the Period Investigated with Generator Status-HUGO.
In the remaining figures in this post, various data smoothing techniques are employed in an attempt to isolate the periodic components of the the lake level measurements.
Figures 2 through 12 are panels of two images each. The title above each individual image explains what smoothing method that was used and the value of the parameter that alters the smooth curve. The black lines are the ‘smooth’ lines, while the red points and lines are the original data.
Lowess smoothing with ff=0.2 and Loess smoothing with span=2 provide the most visually pleasing overall smooth curves through the data.
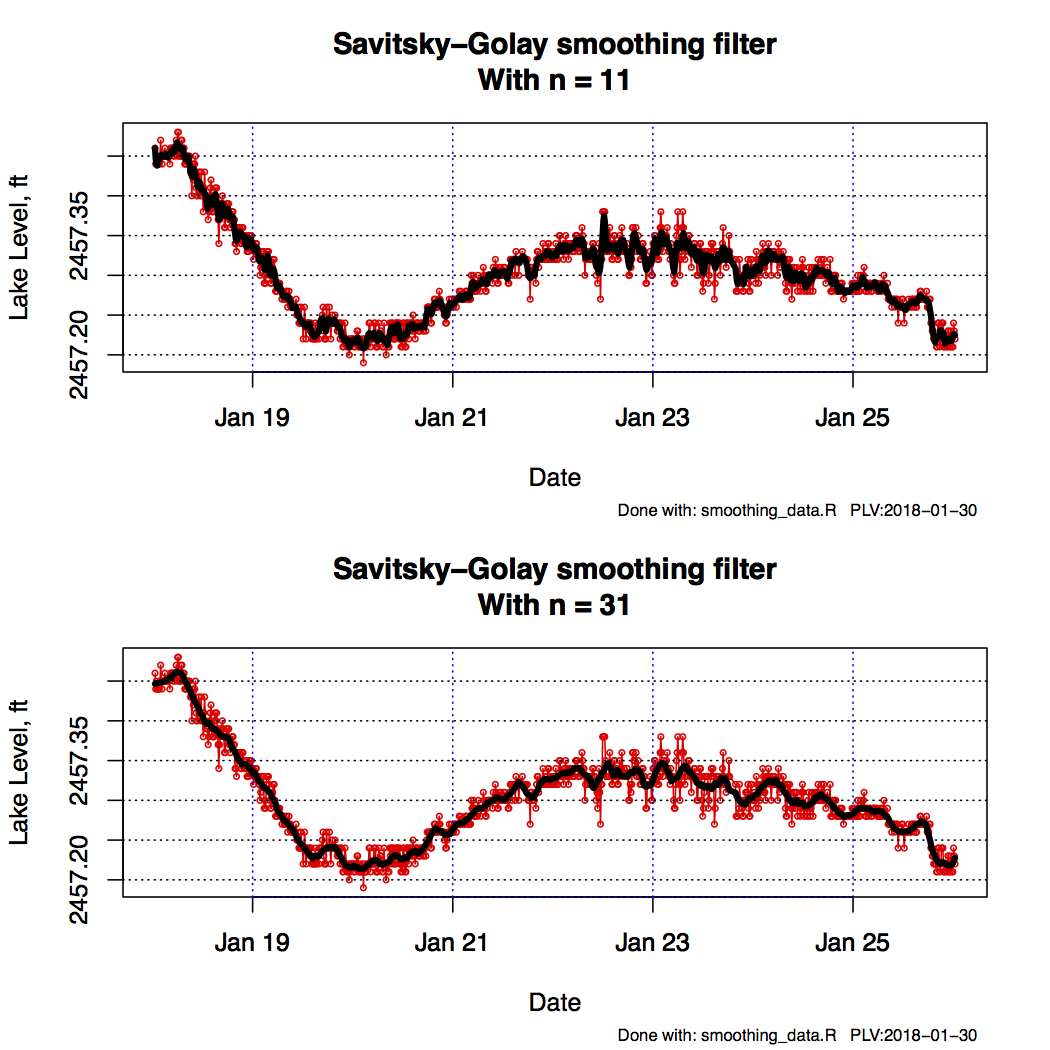
Figure 2. Smoothing with Savitsky-Golay filters.
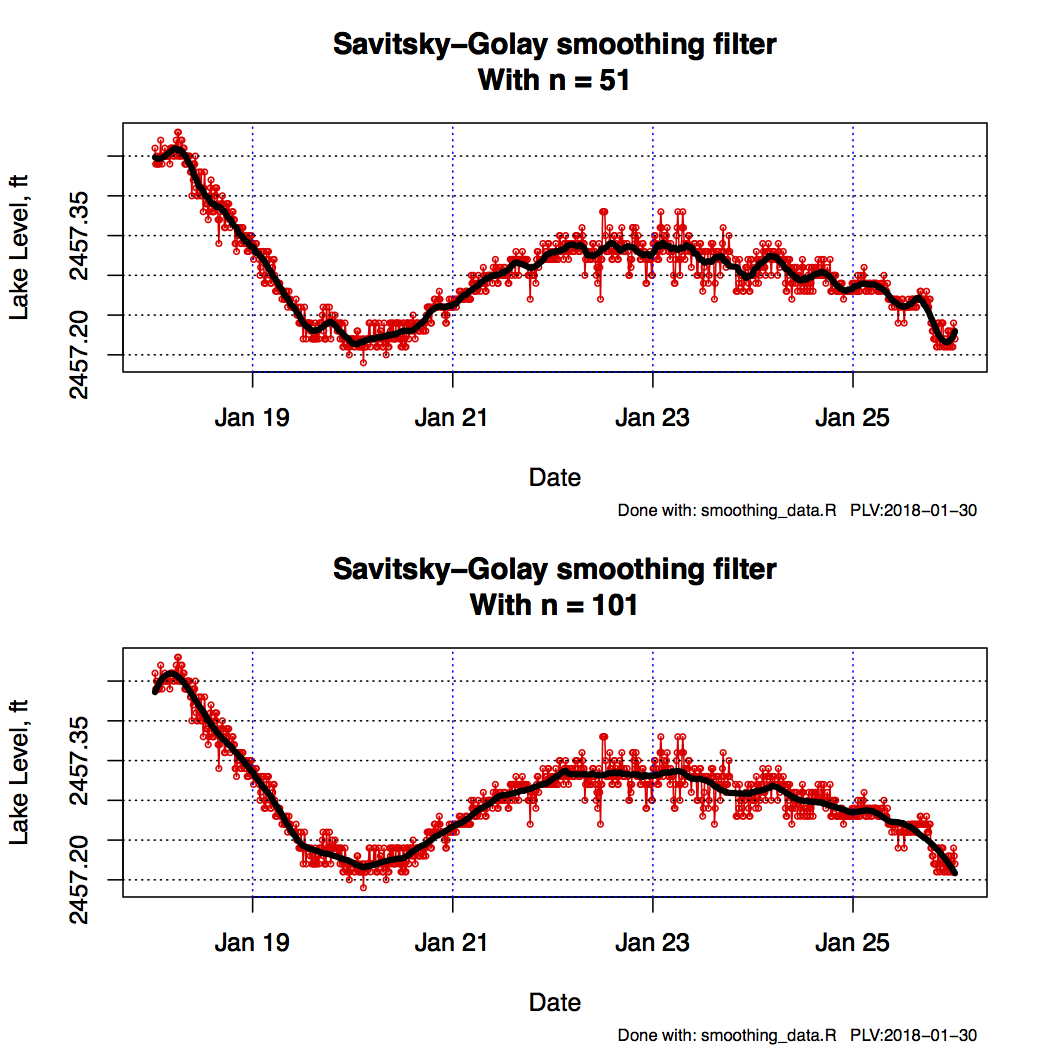
Figure 3. Smoothing with Savitsky-Golay filters.
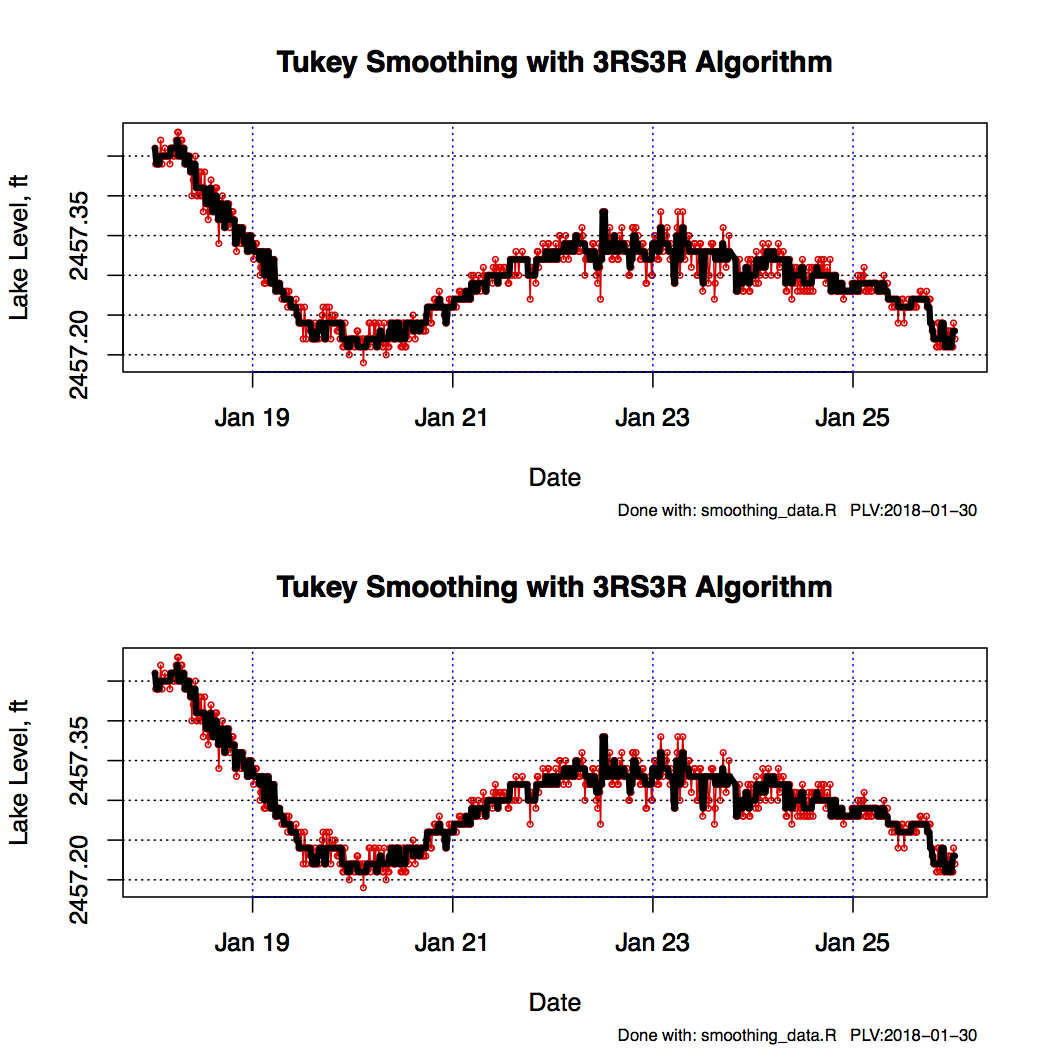
Figure 4. Smoothing with Tukey filters.
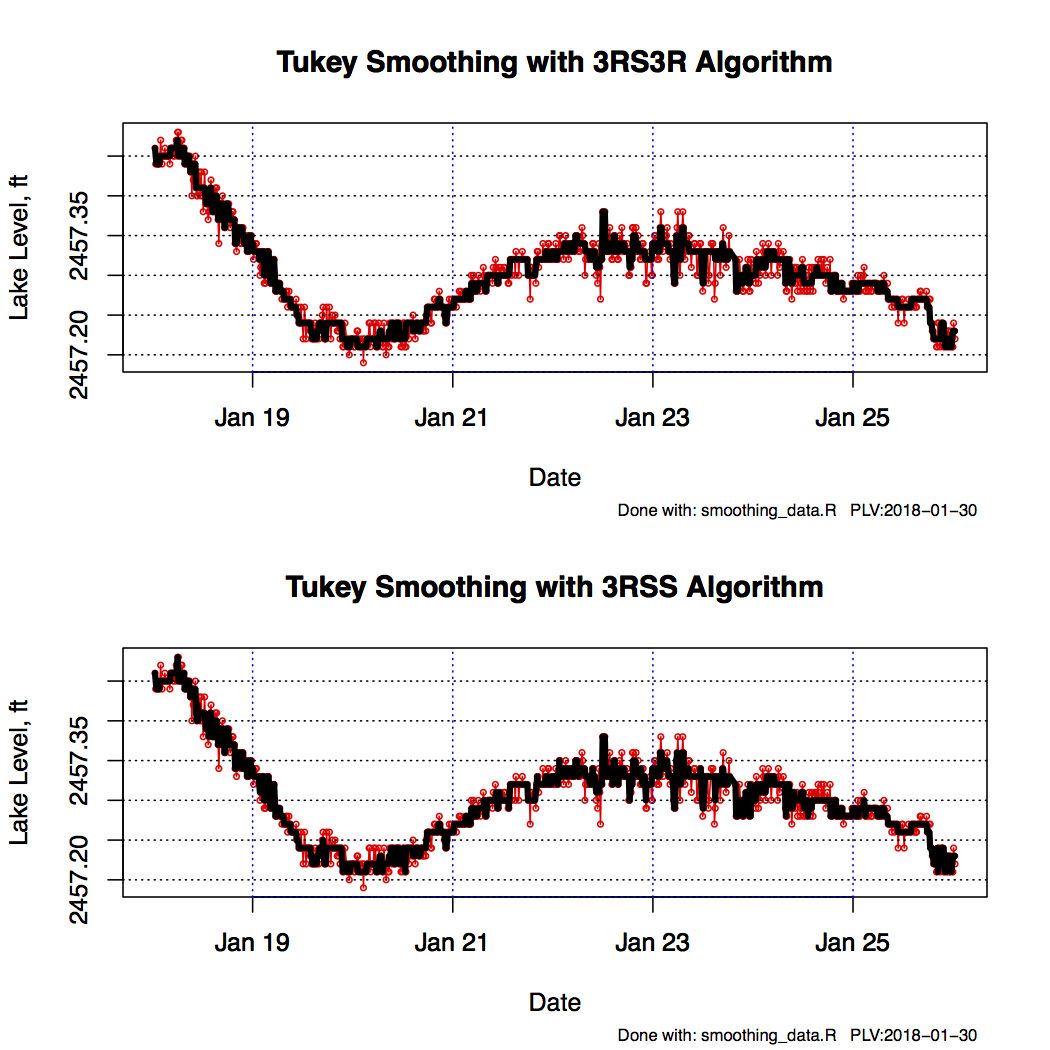
Figure 5. Smoothing with Tukey filters.

Figure 6. Smoothing with Tukey filters.
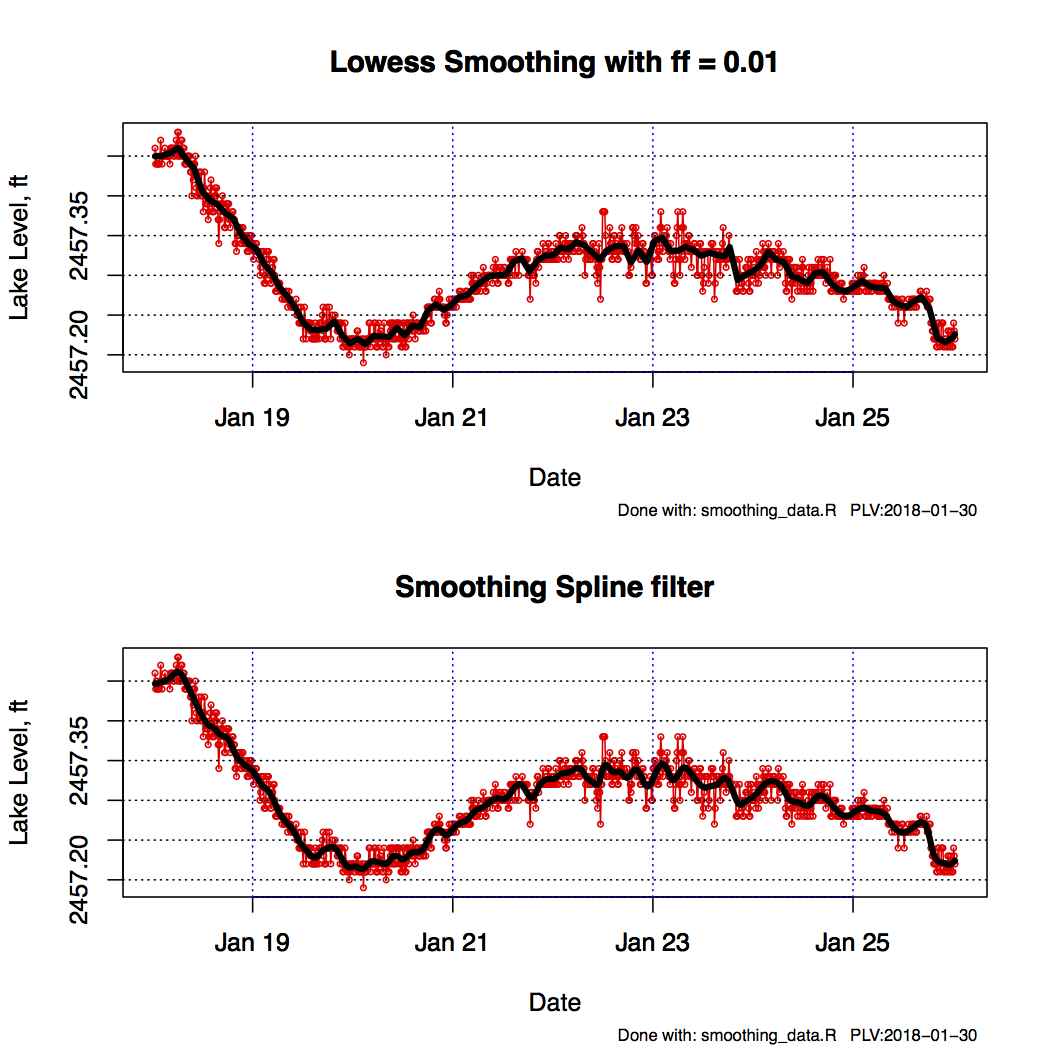
Figure 7. Smoothing with Tukey filters.

Figure 8. Smoothing with Lowess filters.
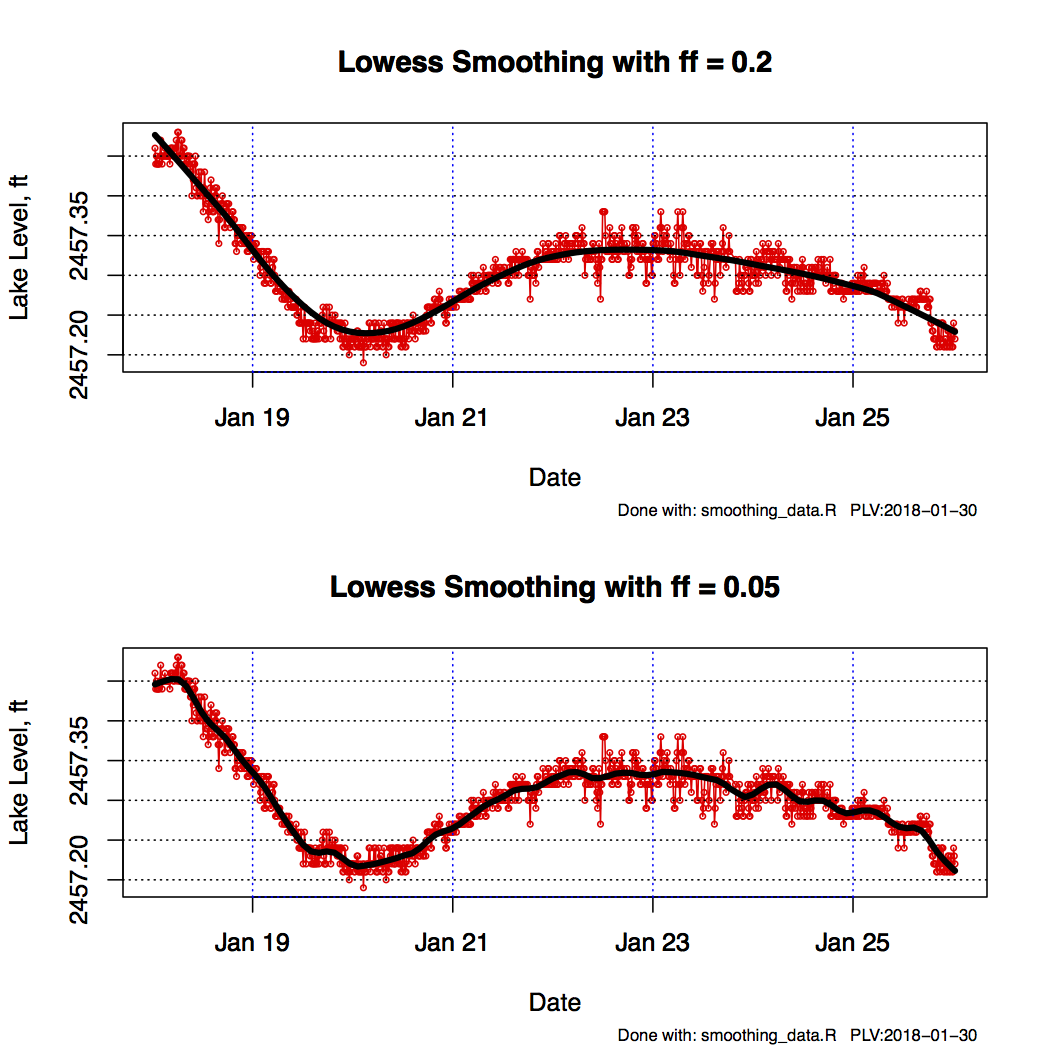
Figure 9. Smoothing with Lowess filters.

Figure 10. Smoothing with Lowess and Spline filters.
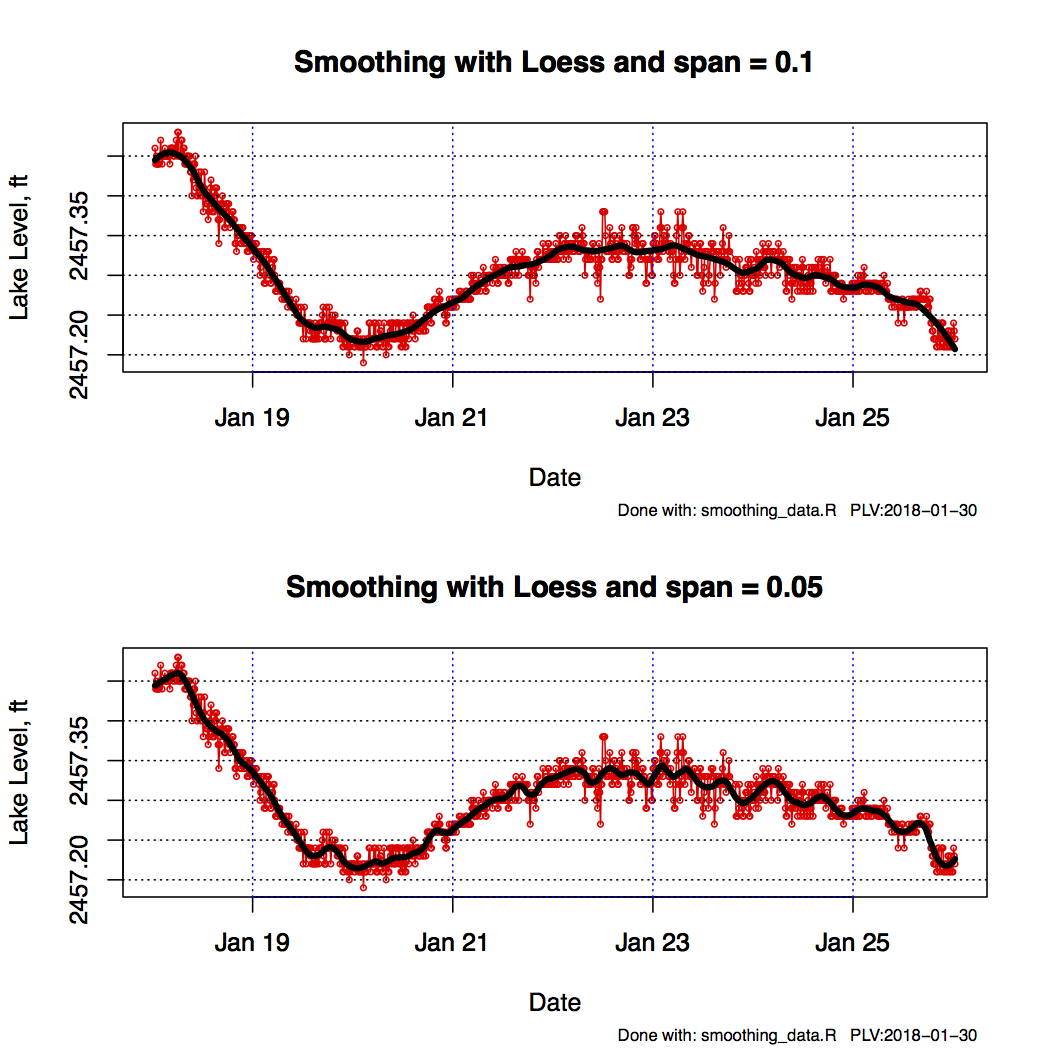
Figure 11. Smoothing with Loess filters.
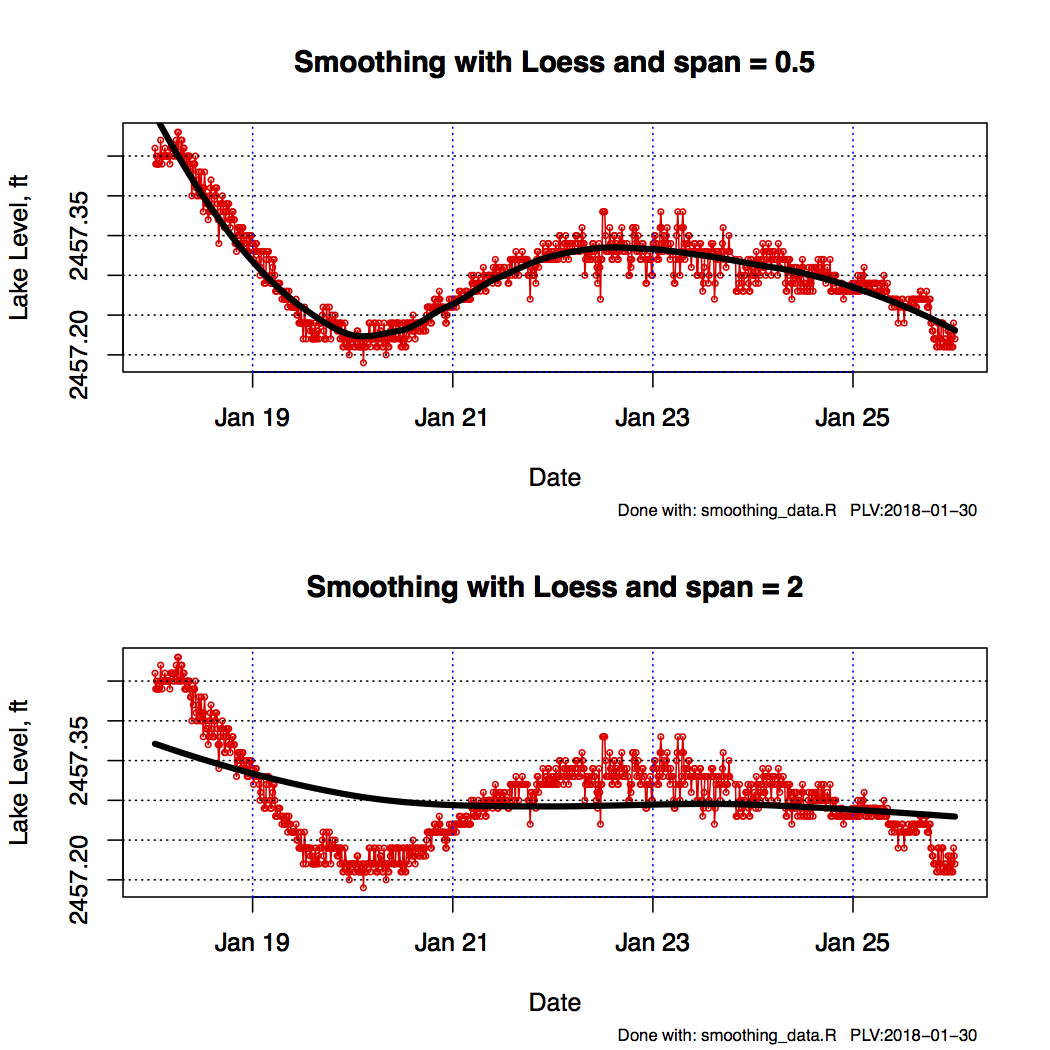
Figure 12. Smoothing with Loess filters.
All of the graphs can be downloaded as a single pdf file here.
Probably the most accurate representation of the data is given by the Savitsky-Golay filter with n=31, the spline filter and Loess with span=0.05. From these the on-off status of the generators is easily discerned.
During the period around January 20, oscillations are observed while the generators are not operating and therefore when no water is being withdrawn from the lake. The raw data are shown in Figure 13.
Various smoothing algorithms were chosen from the previous work to assess the oscillations in more detail, with the results shown in Figures 14-16.
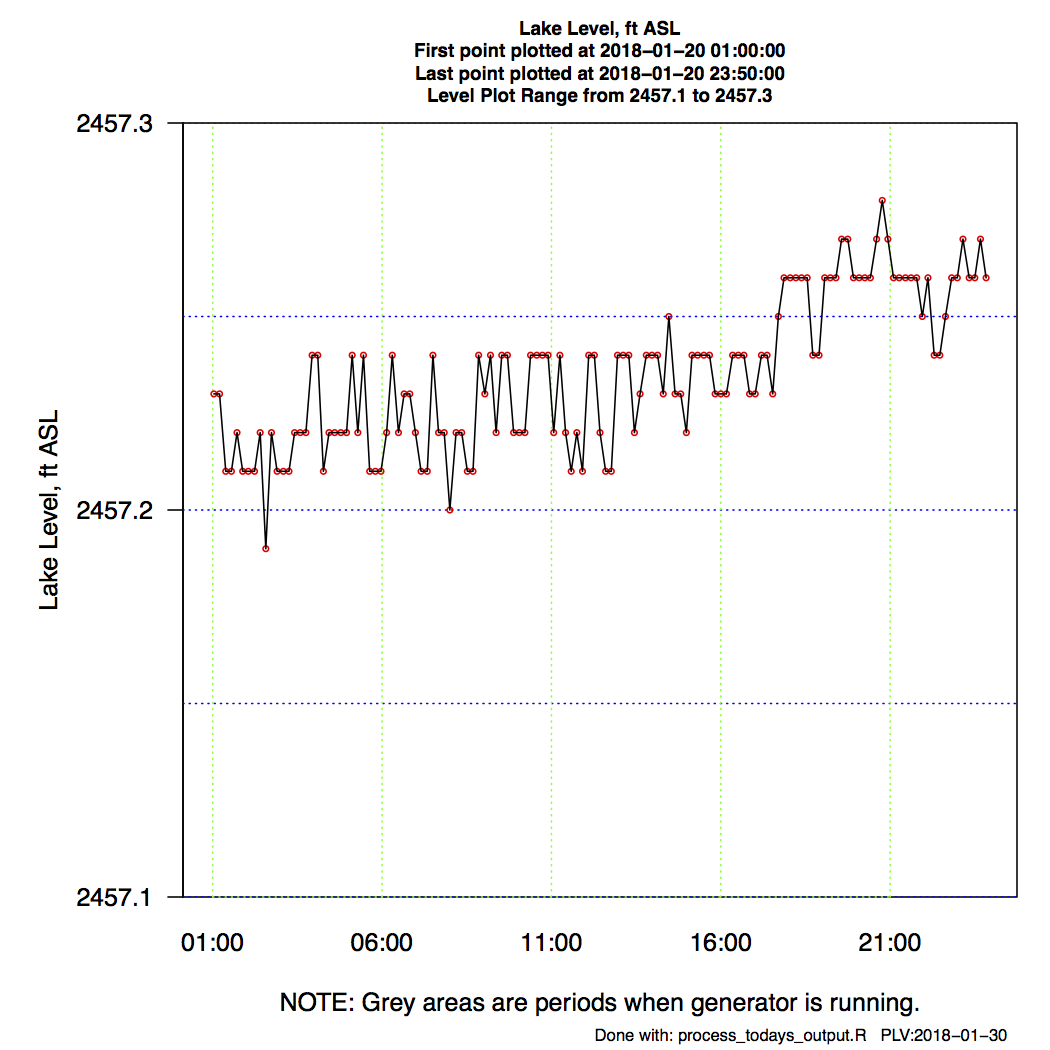
Figure 13. Raw Data of Jan 20.
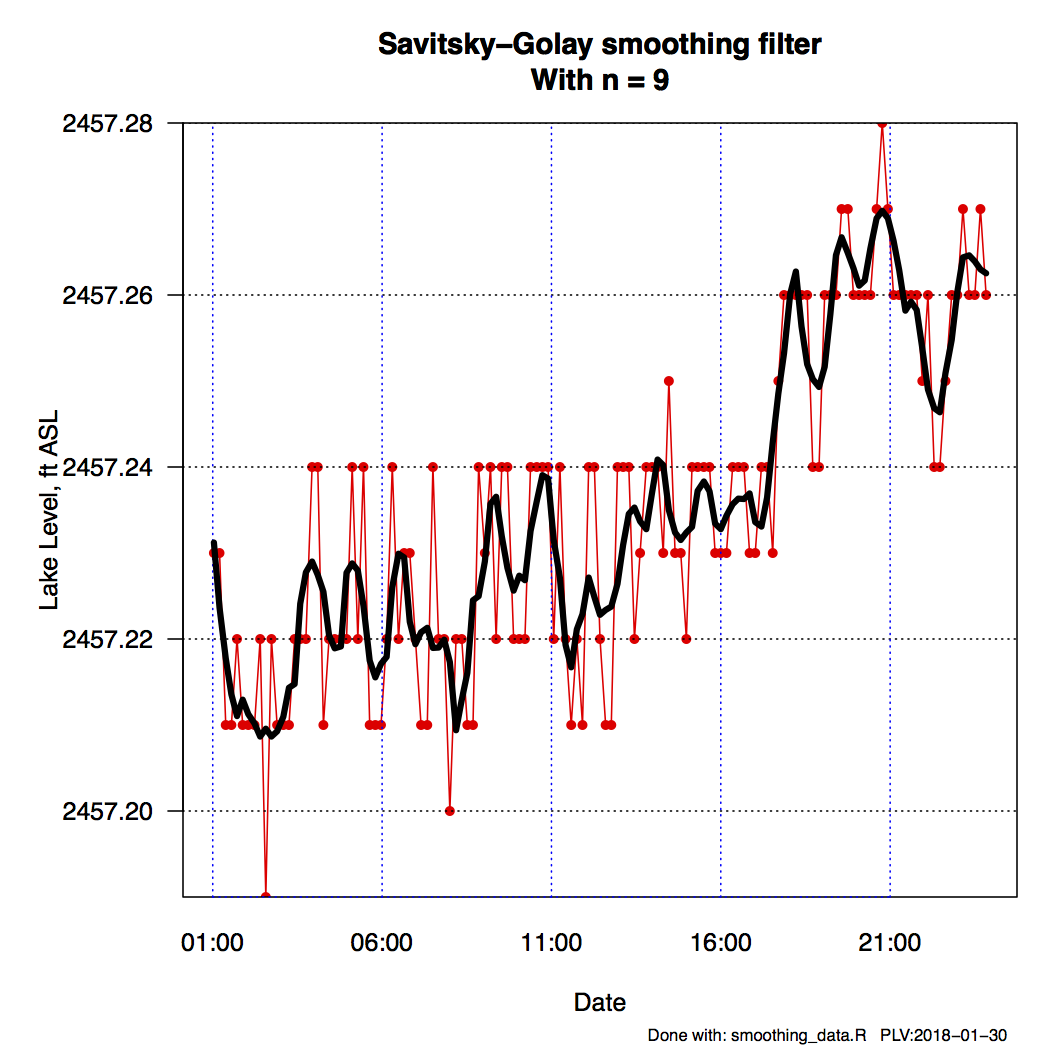
Figure 14. Smoothing of Jan 20 Data with Savitsky-Golay with n=9 Filter.
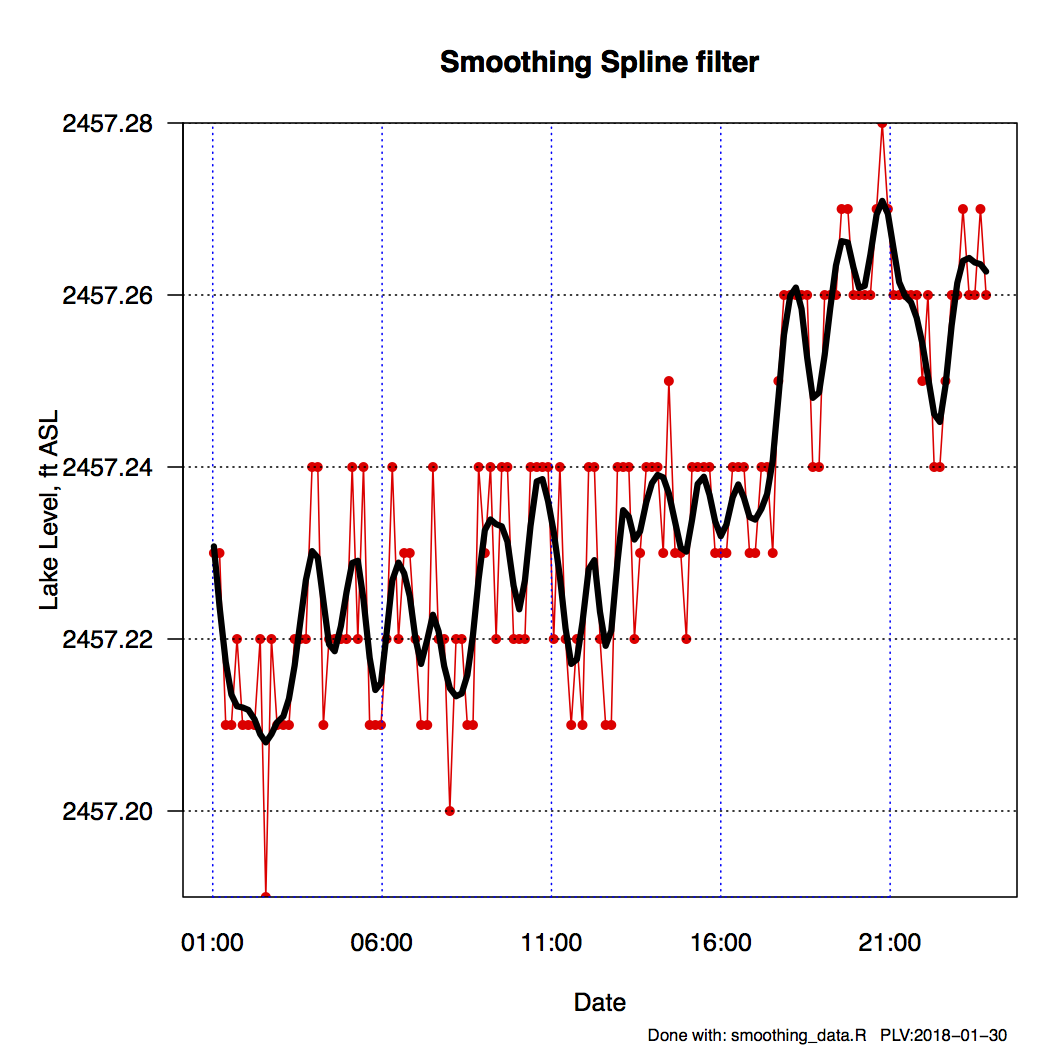
Figure 15. Smoothing of Jan 20 Data with Spline Filter.
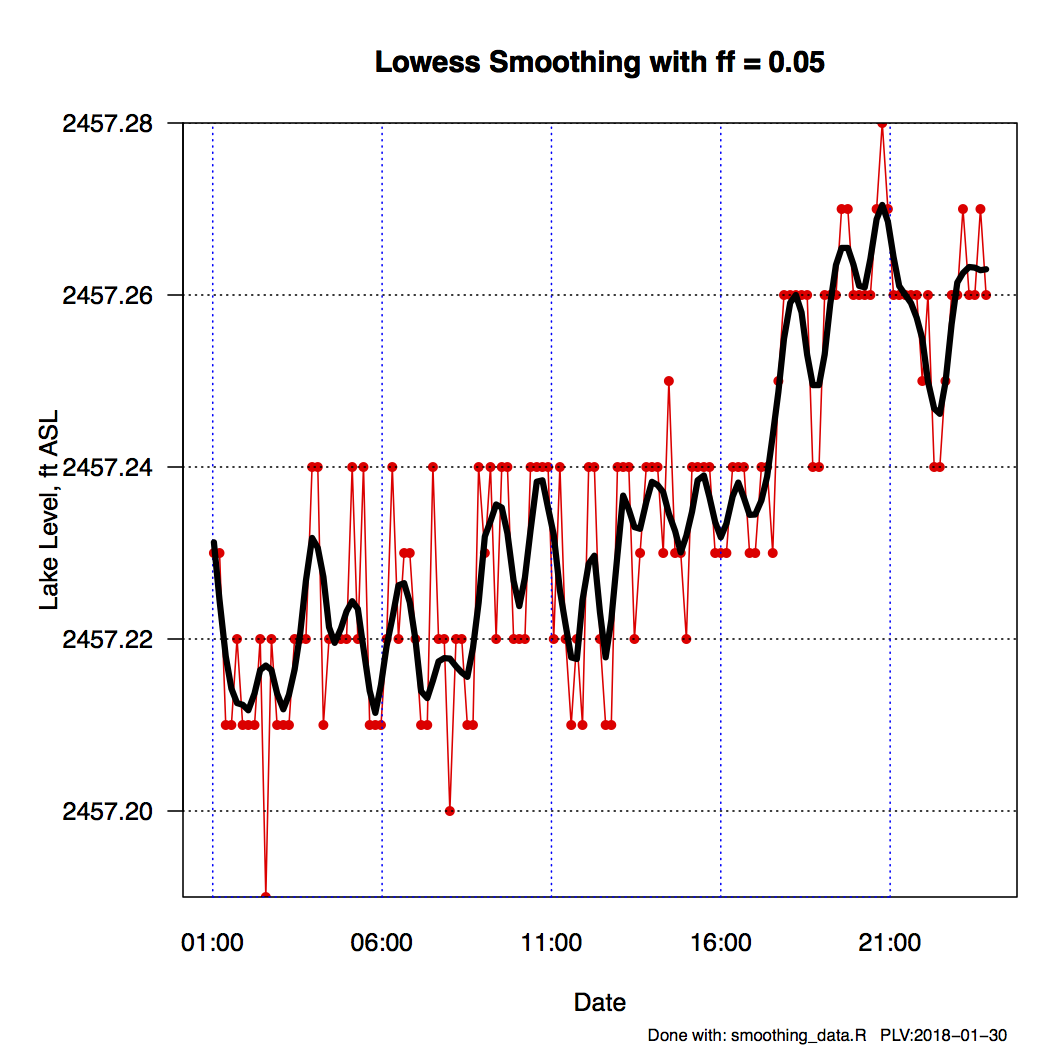
Figure 16. Smoothing of Jan 20 Data with Lowess and ff=0.05 Filter.
Using a Lowess filter with ff=0.05 the peaks are fairly clearly marked as shown in Figure 17. Drawing vertical lines from the peaks to a lower horizontal line, from which measurements are more easily made, and measuring the number of units between peaks, and using a scale factor to convert to minutes and plotting, the results are best represented in the form of a histogram as shown in Figure 18. The average value of this set is 87.4 minutes, not much different from the 90-110 minutes result obtained in 2012 [(see the post referenced here)]({% link _posts/2012-02-12-Wavelets.md %}). It should be noted the for the January 2018 lake levels there is roughly a foot of ice on the lake.
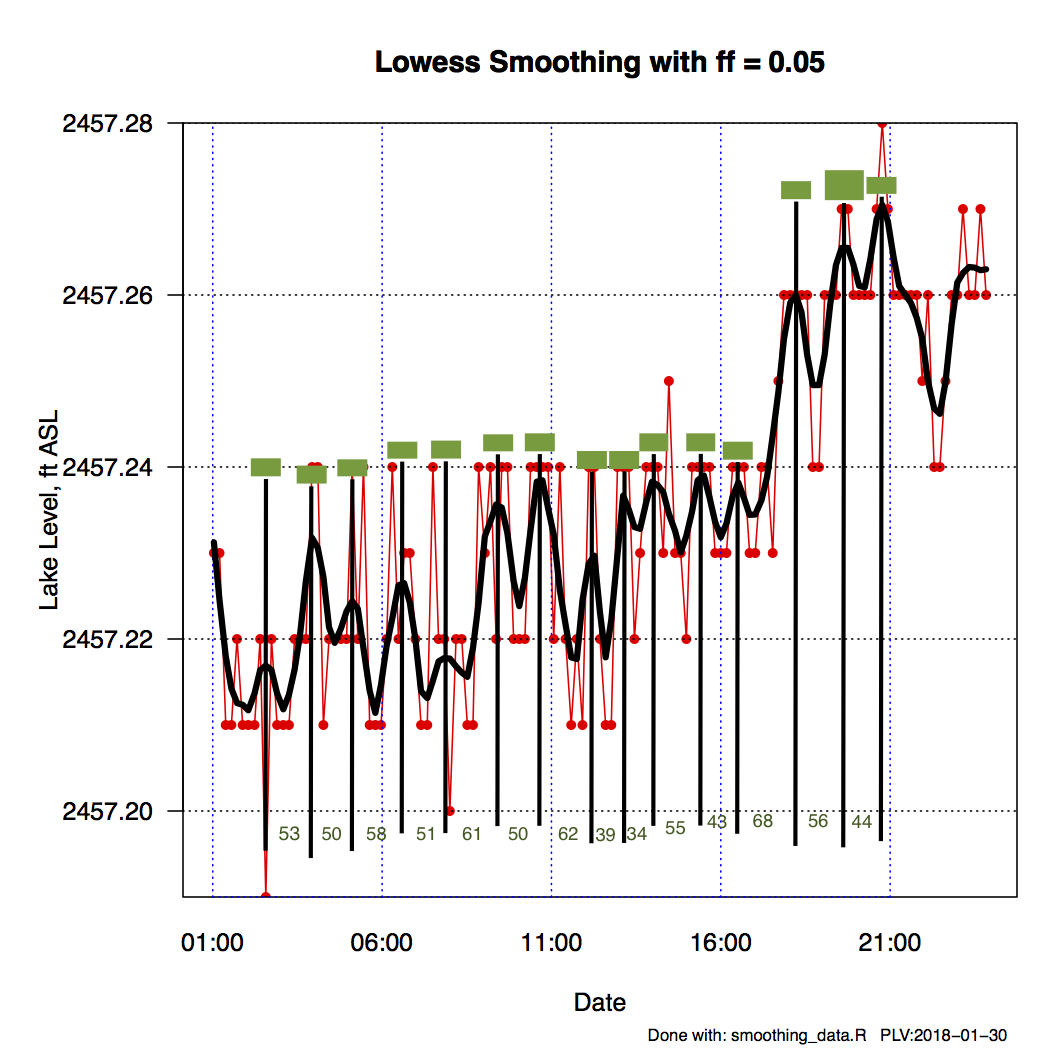
Figure 17. Marked Periods of Jan 20 Data with Lowess and ff=0.05 Filter.
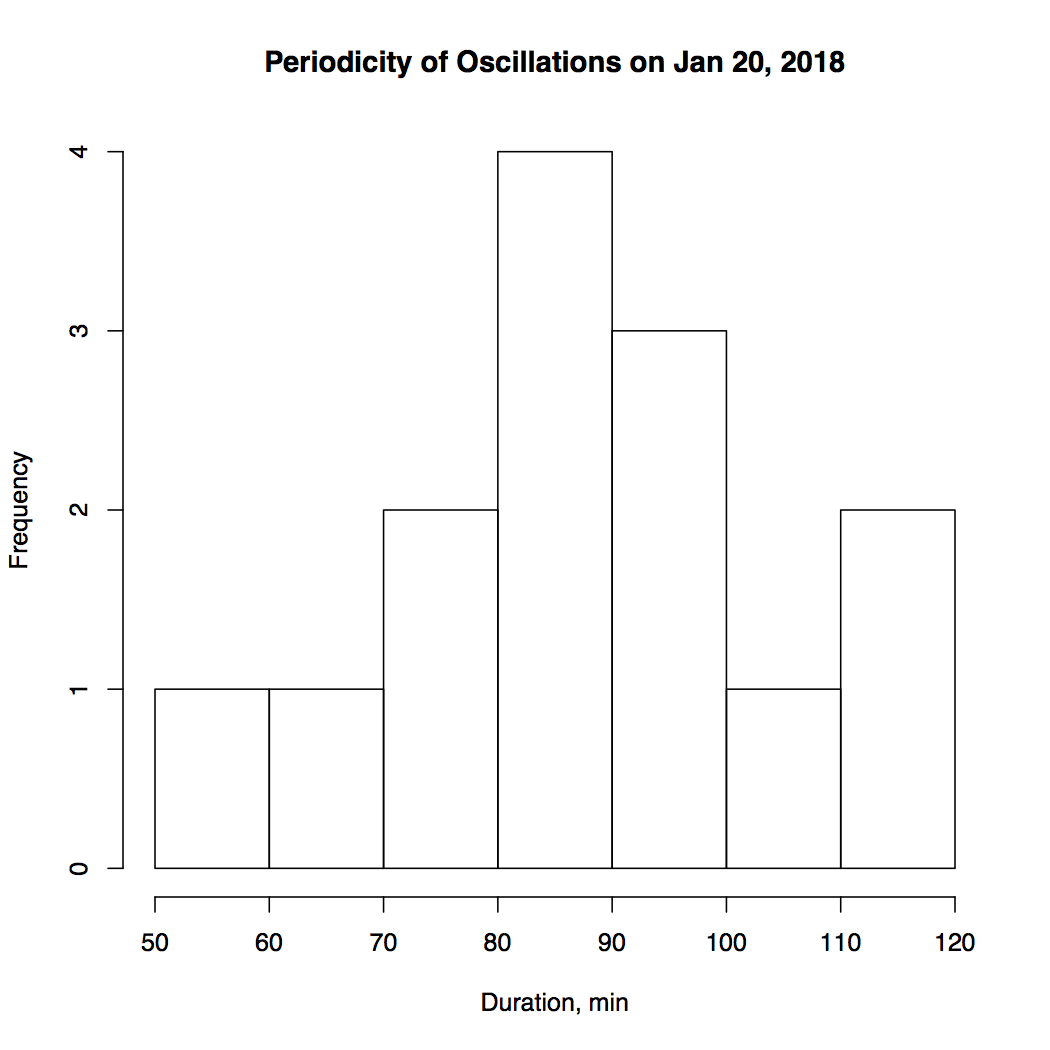
Figure 18. Histogram of Jan 20 Data Measured Periods with Lowess and ff=0.05 Filter.
The oscillations found are probaly seiches. There is a fair amount of literature on seiches, short-period oscillations in an enclosed or semi-enclosed body of water. The following are some works that explore their behavior.
An analytical solution for a rectangular basin of length L and a uniform depth of H is given by Merrians’s formula for the fundamental mode, n=1, adapted from Ref. 3 above:
$$T_1 = \frac{2 L} {\sqrt{g H }}$$
For Deep Creek Lake using a length of 11.6 miles and an average depth of 25 ft one obtains 72 minutes, the result is in the ballpark of the observed values of 50-120 minutes.
Hence might conclude that these oscillations are seiches, sloshing of water from one end of the lake to the other, and probably driven by wind. The amplitude is small, perhaps a fraction of an inch, that’s probably due to the confining effect of a frozen surface. Recall that data was taken in January when the lake is typically frozen. However, this could still be noise on the signal. We’ll wait to update this when the ice is gone from the lake if this becomes important.