Piet's Notes on Deep Creek Lake Science
Sensible Technologies - The Science of Deep Creek Lake
This section of the website describes how an operational system could be implemented. Since all of my work is done on a Mac using the latest version of the OS X operating system, the methods are operating on Mac OS X Version 10.12.6 (16G29). For other operating systems there are similar capabilities which are left to the ‘student’ to implement.
With todays software and computer systems, pretty much everything can be done in a completely automated fashion. However, some people may want to insert an operator in the chain of events, but here, everything will be done automatically.
Computer systems these days, whether they are Mac OS X driven, or Windows driven or Linux driven, all have the capability to automatically launch scripts at specified times.
The Internet provides access to various pieces of information that one needs to make things happen, whether it be lake levels, river flows, or weather, the three principal categories of information needed. Data is collected from these data sources, massaged for the models that need them, and then used to make certain kinds of assessments and forecasts. Once these are completed various websites need to be updated, also automatically, with schedules of water releases, the eventual goal of the effort.
I’ve categorized the required effort as follows:
1. Scraping - Extract raw information from various websites
2. Preprocessing - Cast the raw data collected above into a form that can be used by the various programs/scripts
3. Analysis - Perform analyses with the collected data including how well was done in the past
4. Forecasting - Use the results of the various analyses to make forecasts of releases to be made
5. Publishing - Publish the results to operators, websites and other need-to-know organizations
Let’s examine each of the above steps.
I’m using the term ‘scraping’ rather loosely. Scraping refers to extracting data from web pages without going through an official API (Application Programming Interface). For example, when you go to the Deep Creek Hydro web page that displays the lake level and generator status, the only way that you can get this data onto your computer in some kind of file is by copying and pasting the line with the data. There is no ‘download’ button. This data, however, can be ‘scraped’ by a small script automatically, however often you want. Pretty much any web page can be scraped in this way.
The essence of the script that does this is as follows:
URL <- "https://renewableops.brookfield.com/en/Presence/North-America/Recreation-and-Safety/Deep-Creek-Hydro/Lake-Levels"
thepage <- readLines(URL)
The URL of the page is specified and all of the lines on that page are read. The URL is accessed in minimal time, and I have the whole raw html page on my computer. Now I have to process that page and extract the relevant data. The following lines of code accomplish this.
first.line.number <- grep('<tbody>',thepage)
line1 <- first.line.number + 2
line2 <- first.line.number + 5
x <- vector()
x <- thepage[line1:line2]
# NOTE: The result of this process is the following four lines:
# [1] "                        <td>OFF</td>"
# [2] "                        <td>9/29/2016 03:18</td>"
# [3] "                        <td>2457.75</td>"
# [4] "                        <td>9/26/2016 13:10 </td>"
# The meaning of this data is:
# 1. Generator Status
# 2. Last Reading
# 3. Current lake level (Feet above sea level)
# 4. Last Status Change
I have previously examined how that page is structured and picked off items that I can rely on to be there. Note, however, that Brookfield can change the page layout and structure at any time and I would have to reexamine how to get the data off the site. For now, this is what works. Read the rest of the comments in the code snippet above and one should get the drift.
Next I need to get rid of the html markup elements and extract the data values. I chose to use a R package called “qdapRegex” which contains a function that can do that as follows:
library(qdapRegex)
x <- rm_between(x, "<td>", "</td>", extract=TRUE)
This gives me four quantities stored in a vector “x”, namely: OFF, 9/29/2016 03:18, 2457.75 and 9/26/2016 13:10. That’s basically all there is to it!
I do some additional processing, housekeeping so to speak, such as conversion to the right property and writing the result to a file for later use. This is done by an R script called “deepcreekhydro.R”.
To get the computer to do this automatically one has to run a background job on a timed schedule. On my Mac this can be done in one of two ways ’launchd jobs’ or ‘cron jobs’. The preferred way to add a timed job is to use launchd.
I have a launchd job that runs every 10 minutes. The script for it looks like this:
<?xml version="1.0" encoding="UTF-8"?>
<!DOCTYPE plist PUBLIC "-//Apple//DTD PLIST 1.0//EN" "http://www.apple.com/DTDs/PropertyList-1.0.dtd">
<plist version="1.0">
<dict>
	<key>EnvironmentVariables</key>
	<dict>
		<key>PATH</key>
		<string>/usr/local/bin:/usr/bin:/bin:/usr/sbin:/sbin:</string>
	</dict>
	<key>KeepAlive</key>
	<dict/>
	<key>Label</key>
	<string>com.pitiur.deepcreekhydrodata</string>
	<key>ProgramArguments</key>
	<array>
		<string>/DAS/scripts/extract_hydro_data</string>
	</array>
	<key>StartInterval</key>
	<integer>600</integer>
</dict>
</plist>
For this script to work it must be located in a very special place on my computer. What this says is execute the ‘bash shell’ script “extract_hydro_data” every 600 seconds. Now, the bash script looks as follows:
#!/bin/bash
cd /DAS/code/
R < deepcreekhydro.R --no-save
R < lakelevelbox.R --no-save


# For the deepcreekanswers.com website
USER='YourUserName'
PASS='YourPassword'
/usr/bin/ftp -inv 69.195.124.109 << ftpEOF
   quote user $USER
   quote PASS $PASS
   prompt
   asci
   cd /public_html/deepcreekanswers/i_files
   lcd /DAS/results/
   put i_leveldata.php
   cd /public_html/senstech/i_files
   put i_leveldata.php
   quit
ftpEOF

# For the deepcreekscience.com website
USER='YourUserName'
PASS='YourPassword'
/usr/bin/ftp -inv ftp.deepcreekwatershed.org << ftpEOF
   quote user $USER
   quote PASS $PASS
   prompt
   asci
   cd ./deepcreekscience/i_files
   lcd /DAS/results/
   put i_leveldata.php
   quit
ftpEOF
What the last script does it executes two R scripts, namely ‘deepcreekhydro.R’, the one discussed earlier, and ’lakelevelbox.R’. The latter one produces the web page segment for use in a ’lake status’ box that can be seen on ‘deepcreekanswers.com’ and on “deepcreekscience.com.” That file is also put on the “senstech.com” website but currently not used.
The ’lakelevelbox.R’ script uses information collected by the first script and generates web page segments, namely in the form of a ‘.php’ file which is processed by the website when it is called upon.
With this scheme my various websites are updated automatically every 10 minutes.
This scheme can be used in lots of different ways. For example, the following bash shell script is run automatically every morning at 5 am.
#!/bin/bash
cd /DAS/code/
# weather_data_gca.R extracts historic weather data from Garrett County Airport
R < weather_data_gca.R --no-save
# weather_html5.R processes weather data from Garrett County Airport and create Highcharts graphs
R < weather_html5.R --no-save
# usgs_gages.R reads historic data from USGS gages on the Youghiogheny River
R < usgs_gages.R --no-save
# usgs_Oakland_display.R displays the USGS gage readings for Oakland in a graph
R < usgs_Oakland_display.R --no-save
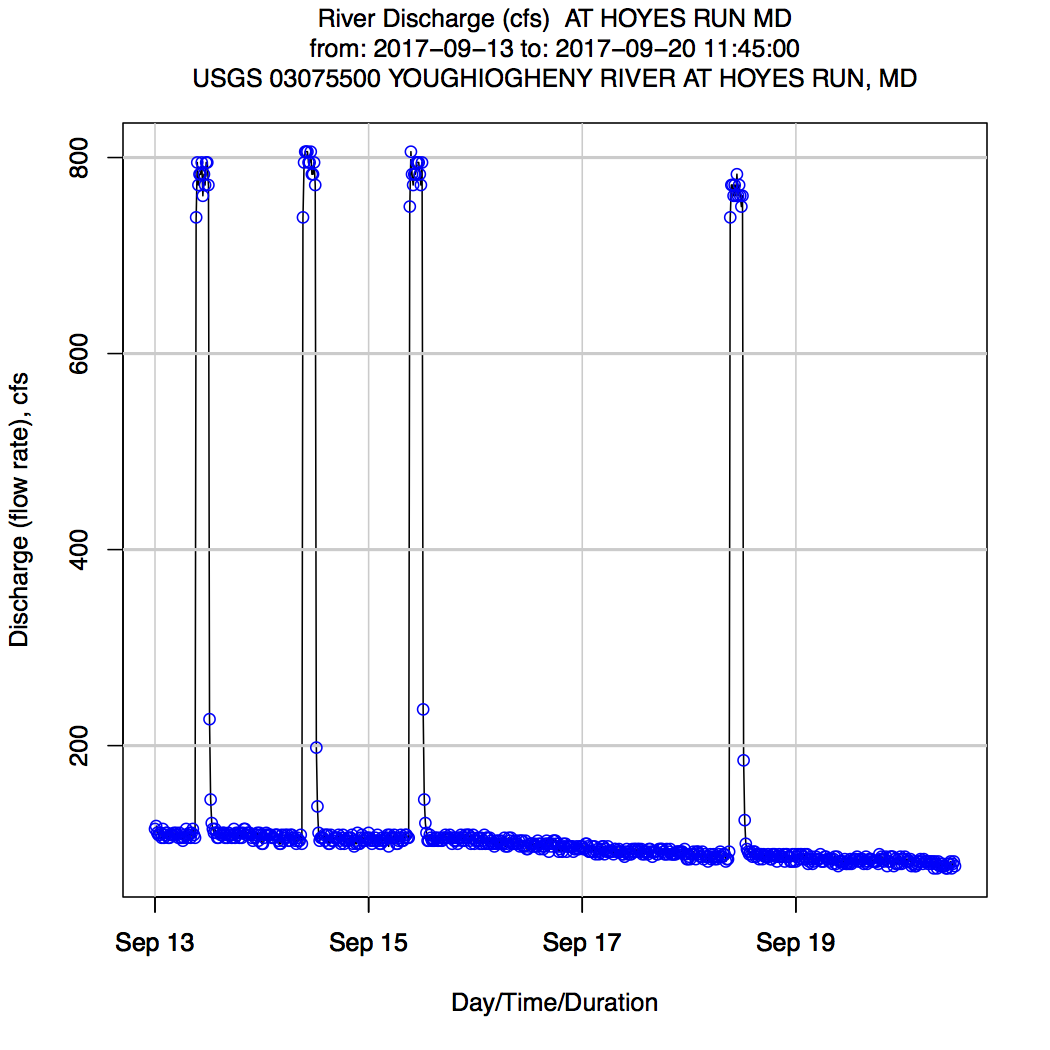
# usgs_Hoyes_display.R displays the USGS gage readings for Hoyes Run in a graph
R < usgs_Hoyes_display.R --no-save
# usgs_Friendsville_display.R displays the USGS gage readings for Friendsville in a graph
R < usgs_Friendsville_display.R --no-save
# Post processing of data
# First process the lake level data
R < process_todays_output_7days.R --no-save
# Use the lake level data to create the generator ON/OFF table
R < generator_on_off_7days.R --no-save
# Next display the combined generator ON/OFF and the USGS gage flow data
R < usgs_hoyes_display_7days.R --no-save
# For the deepcreekscience.com website
USER='YourUserName'
PASS='YourPassword'
/usr/bin/ftp -inv ftp.deepcreekwatershed.org << ftpEOF
quote user $USER
quote PASS $PASS
prompt
asci
cd /deepcreekscience/hcgraphics
lcd /DAS/html/
put hrel.php
put mbar.php
put tamb.php
put tdew.php
put wspd.php
cd ../deepcreekscience/realtime
lcd /DAS/results/
put graph_todays_output_7days.pdf
put OaklandHydrograph.pdf
put Yough_HoyesRun_Hydrographs.pdf
put Yough_Friendsville_Hydrographs.pdf
quit
ftpEOF
In essence what this script does is the following:
NOTE: The following charts are no longer active, because websites they are on are boing closed down.
The chart generated for the lake levels over the past 7 days can be found here The charts generated with the weather data from Garrett County Airport can be found here. The charts generated for the Oakland, Hoyes Run and Friendsville USGS gages can be found here
For completeness, here are examples of some of these charts.
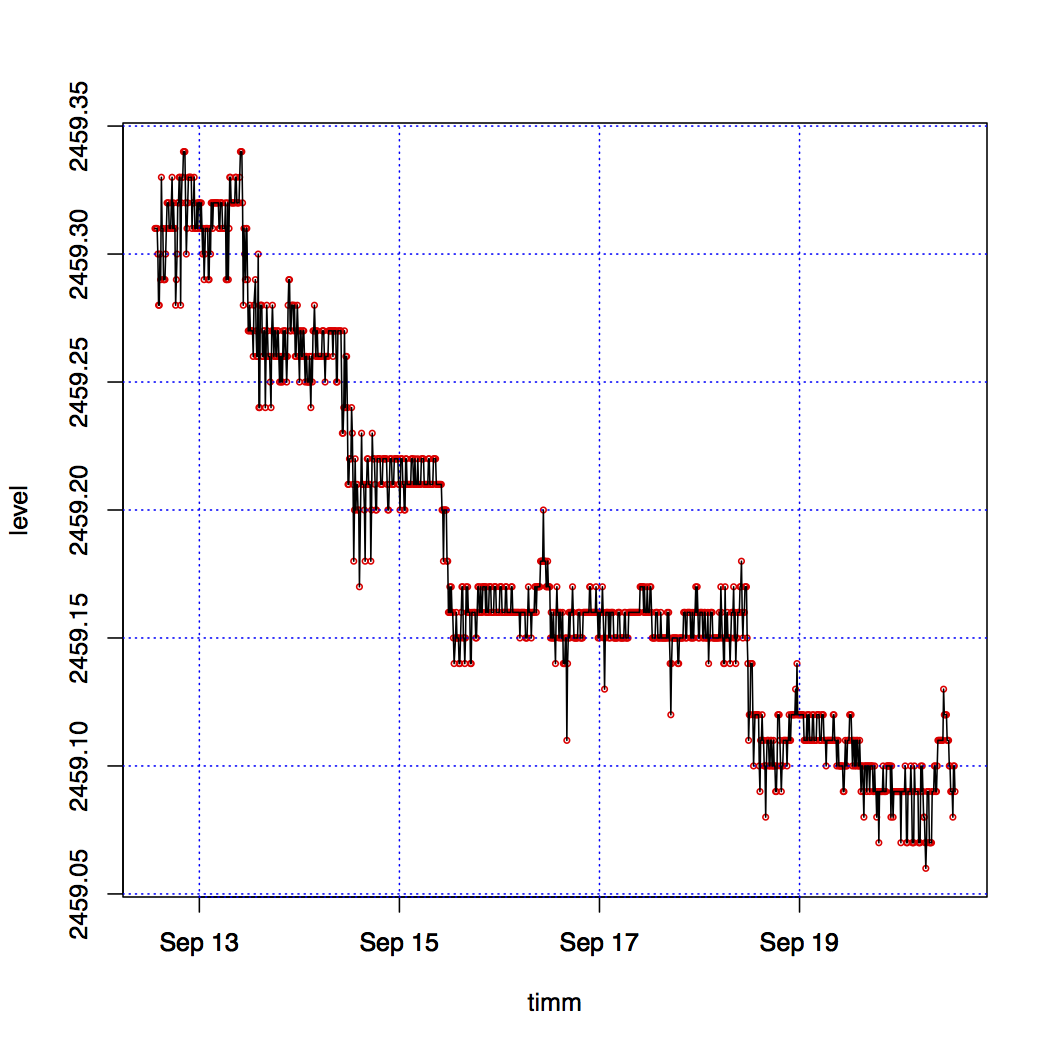
Figure 1. Typical Graph with the Last 7 Days of Lake Levels.
While this is not a completed product, the intent is to show that one can automatically generate the necessary data and graphs in order to do further analyses.
The next item to accomplish is to analyze the data at hand and to cast them in a format that the forecasting methodology can use. This is work in progress, since the details of how to make a forecast have not yet been settled on.
This is probably the most complicated aspect of the whole problem. This is ‘work in progress.’
Publishing the results automatically has already been shown under Section 3 already. In addition to publishing results on various web pages, it’s foreseen that publishing is also done in the form of ‘alerts’ via a Facebook page, for example. There are many other ways to publish announcements of various kinds as demanded by the forecasting methodology. This is also ‘work in progress.’