Piet's Notes on Deep Creek Lake Science
Sensible Technologies - The Science of Deep Creek Lake
Having the clean raw data in lat/lon format, they now need to be converted to the MD State Plane Coordinates System.
Let’s look first at what the measured data tracks look like for one of the 9-day long data acquisition process (there were a couple of bad weather days in between when data could not be taken).
The data were acquired in 2011 on:
April12lonlat_clean.txt   48220 obs.
April13lonlat_clean.txt   62193 obs.
April16lonlat_clean.txt   106137 obs.
April17lonlat_clean.txt   116308 obs.
April19lonlat_clean.txt   90055 obs.
April20lonlat_clean.txt   97236 obs.
April21lonlat_clean.txt   96843 obs.

For a total of 616,992 observations
The raw data looks typically like:
  Longitude Latitude    Depth
1 -79.26224 39.50228 3.554316
2 -79.26692 39.50674 3.554316
3 -79.31440 39.48826 3.554316
4 -79.31681 39.48983 3.554316
5 -79.32139 39.48421 3.554316
6 -79.25812 39.50504 3.586924
where depth is in feet.
After the conversion to MD SPSC the data looks as follows:
     Depth  Easting Northing
1 3.554316 674017.8 676436.8
2 3.554316 672738.5 678097.1
3 3.554316 659175.5 671702.9
4 3.554316 658508.8 672291.3
5 3.554316 657164.7 670277.7
6 3.586924 675205.7 677415.4
Figure 1 shows all the data taken on April 16.
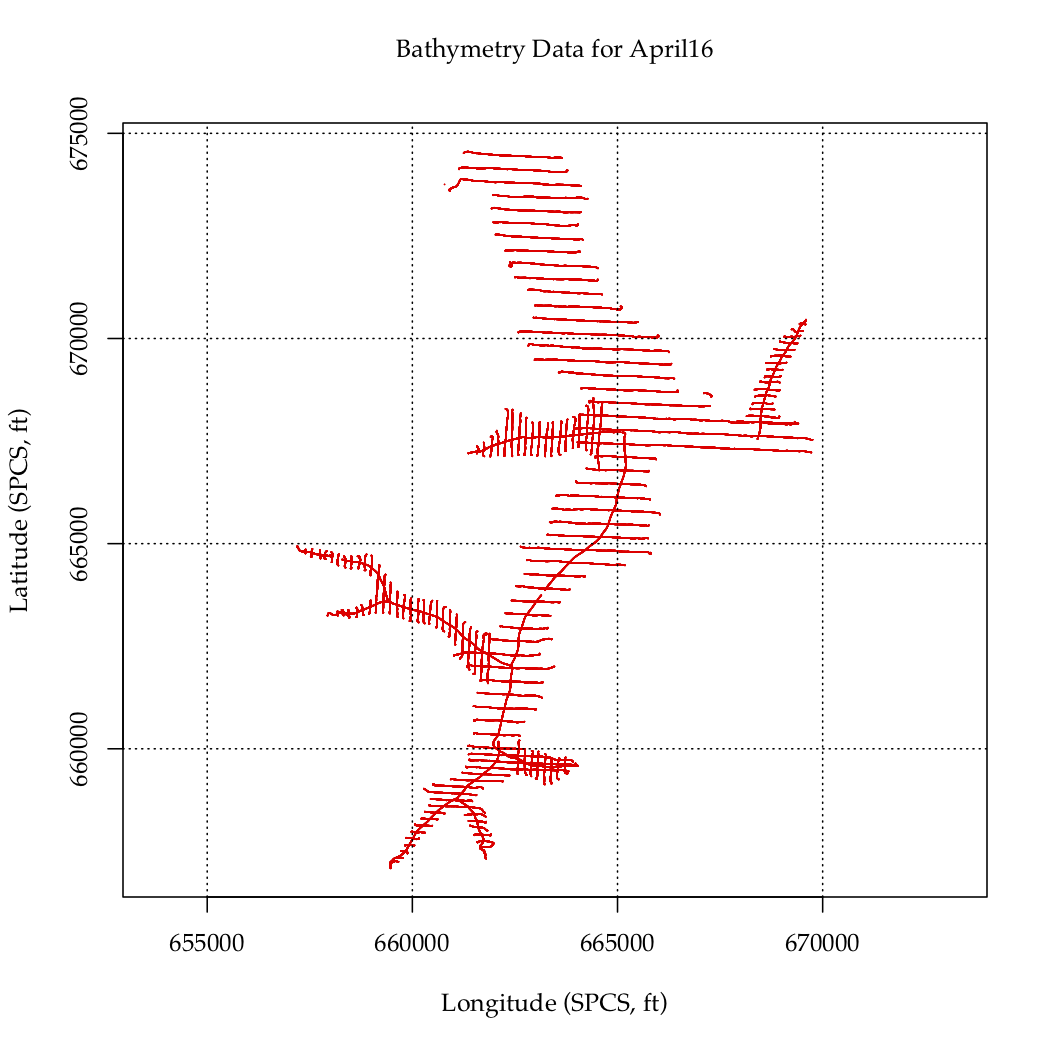
Figure 1 - Bathymetry Measured on April 16
Figure 2 shows all the data for the whole lake.
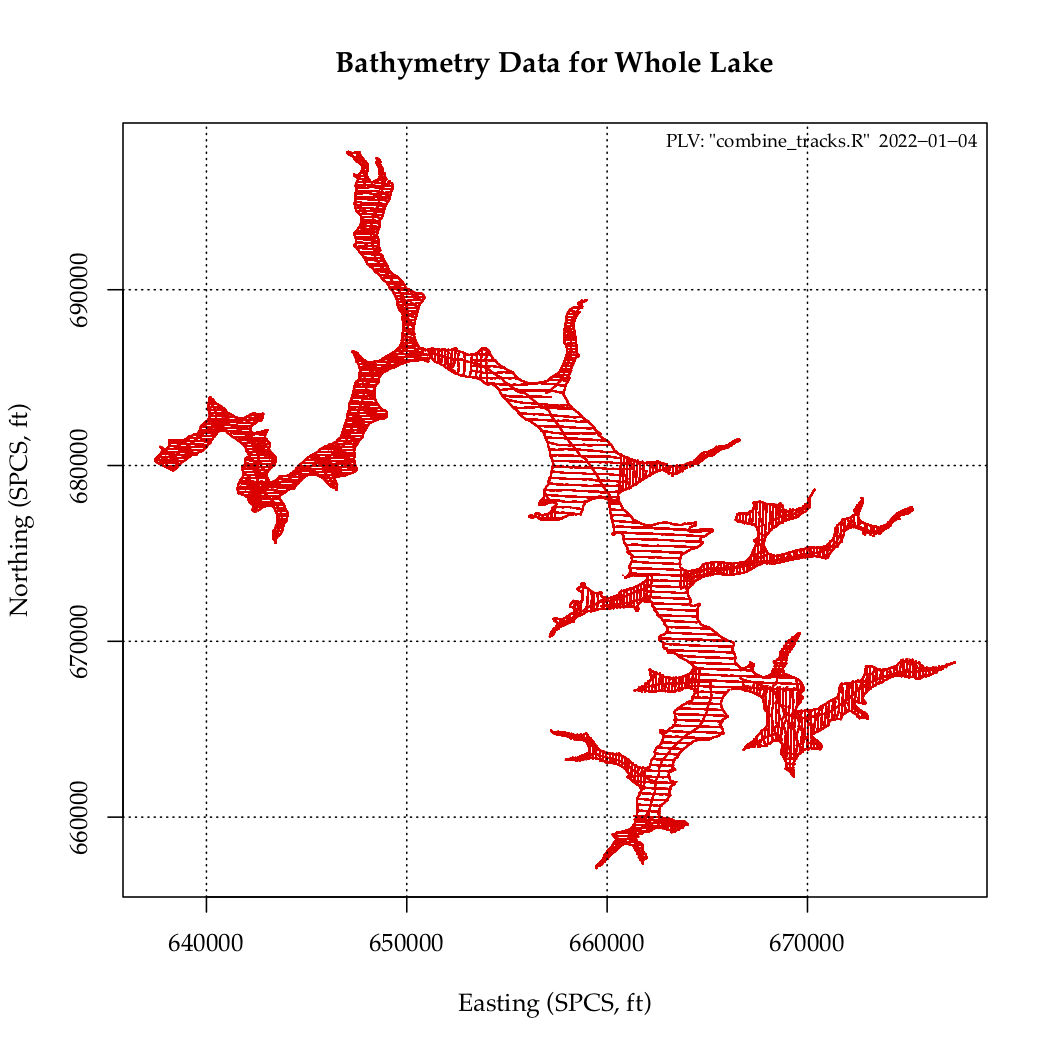
Figure 2 - All Measurements Made.
Figure 3 shows every 50th point of the data set. As can be seen this should still provide plenty of coverage for an interpolation scheme.
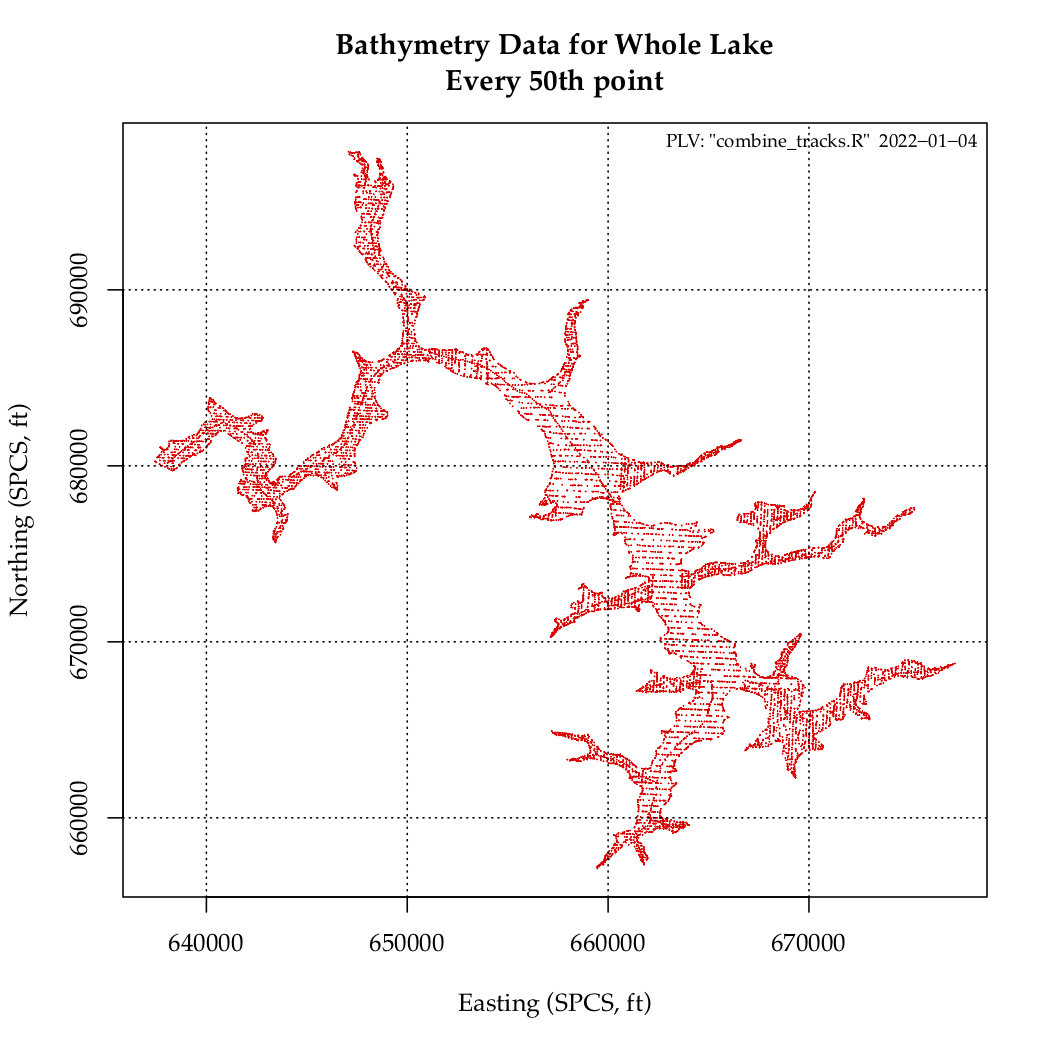
Figure 3 - All Measurements Made.
PLV
First Published: 01/05/2022