Piet's Notes on Deep Creek Lake Science
Sensible Technologies - The Science of Deep Creek Lake
There is a great deal of confusion and misinformation floating around regarding the water level at Deep Creek Lake. This report documents research performed by the author to clarify some of the issues on this subject. This clarification is done in the form of understanding the water budget of the lake; where does the water come from and where does it go. Understanding the water budget requires an evaluation of existing data and of modeling the water level of the lake. The challenge is to first find reliable measurements of various kinds, including weather and water levels, understand the meaning of the data, and develop a model that reflects the physical behavior of the lake.
This is a preliminary report. Much more work remains to be done, but I believe that it is important to report my findings before expensive api work gets done that may not address the issues properly.
I’m going to start out small and the whole will hopefully evolve into a tool and an approach that can be used reliably and with insight. We shall see.
The principal objective of this effort is to devise an approach that can accurately predict the lake’s water level given a set of basic, readily obtainable, information. The target is to be able to predict the water level at any time within ½ of a foot.
Factors Affecting the Lake Water Level
Let’s first list the factors that affect the lake water level. There is no ordering in the list as to what is more important. It’s just a list whose items need to be examined in detail. As with all things in science certain factors are related and dependent on others. I hope to tease all these apart.
The lake has a large surface area and it stands to reason that evaporation can be important. To our knowledge there are no measurements of that affect for Deep Creek Lake. It is affected by air-water temperature differences, the humidity of the air, solar radiation, and wind speed. Evaporation takes place in different areas, and each will require a different model. We’re concerned with: Lake water evaporation Canopy evaporation Releases thru the hydro-electric turbines To a limited extent, Deep Creek Lake levels can be controlled by the Deep Creek Hydroelectric Station which operates under a Water Appropriation and Use permit from the Maryland Department of the Environment (MDE). Under the permit conditions, the Station, which is owned by Brookfield Renewable Power, uses water to generate hydropower, but keeps lake levels within a defined “rule band” with upper and lower limits. The permitted release schedule can be found here. The parameters of the plant are well published, but perhaps not verified. Leakage around the hydro-electric plant Various leakages have been mentioned, pennstock, wicket gate, but not quantified, nor how long they have existed. Brookfield (and Pennelec) records should provide some insight.
The dam is across Deep Creek. There still exists a stream beyond the dam. Permitted removal Several permits exist to draw water from Deep Creek Lake. The companies permitted to withdraw water from the lake are: Brookfield Power for the hydroelectric project Recreational Industries for irrigation of the golf courses, providing water to ASCI and for snow making Thousand Acres for irrigation of the golf course MDE/DNR for temperature enhancements for fish in the Youghiogheny river and white water recreational activities on the Youghiogheny river Their withdrawal rate is unknown, except for the permit levels.
We wished to keep things simple. Our approach to understanding the water budget revolved around the following ideas:
Each of these points are discussed below.
1. Data
Calculating a viable water budget for the lake, with any tool, requires a certain amount of reliable data. This section lists the kind of data required. Unless mentioned otherwise, we were seeking a complete data set for the year 2011, Jan 1-Dec 31, 2011. For our current purposes, we were looking for daily average data. But, anything on a smaller time scale is clearly usable since we can create the daily averages form that. Hopefully such data is digital, but equations are also acceptable.
So here is the list.
We’ve made significant progress in all of these areas.
We have tracking down pretty much all of the weather data that exists for the area. Appendix A provides a detailed listing do data sources. The most reliable current data is from the McHenry airport. Their weather station means aviation standards and is checked and calibrated, if necessary, quarterly. It is close to the lake and for most of the measurements it should be representative of conditions a the lake. Unfortunately, the most important item is missing, precipitation data.
We have not paid much attention to this topic, since it is currently of no direct consequence.
We were not able to readily find historic water level data. However, we have been able to collect extensive data on water level via the power station’s website. The methods are described in Appendix B. This data has provided us with some significant insight as to what is going on with the water in the lake. This is discussed later on in the results section.
The State of Maryland, via USGS, has a number of modeling tools for computing and tracking the water budget and water quality of the lake. Being in a position to use them correctly and with confidence is beyond our scope and desire. We have chosen Simgua. as the tool to do our modeling. Simgua belongs to a category of computer programs called “System Dynamics.” It’s a mathematical modeling technique that can be used to examine the time dependent behavior of complex systems. Other tools of this genre include Stella, Vensim, and others. For a historical background of this technology see the article in Wikipedia. Simgua is a Mac OS X tool only. Models in Simgua are built along the concepts of stocks, flows and feedback, as with the other simulation tools. It’s extremely easy to use and has a very friendly user interface. While Simgua is the simulation tool, to make it do its work correctly we need models for the different phenomenologies that take place in creating the water budget. This section describes the models that will be used initially. As we gain more experience, other models may be used, or we may extend the existing models. The lake is a dynamic system. While intrinsically possible, the simulations should probably be done on an hourly basis, given that water releases are defined in terms of hours. Given the status of the needed data and the desired accuracy, average daily flows and conditions should probably be adequate. Hence, that will be our initial focus.
A detailed description of Deep Creek Lake is provided elsewhere in a separate blog post.
This section describes the results that have obtained so far.
As described about, Simgua has been used to do modeling of the water budget. A very simplistic approach has been used initially. The initial equation set solved is:
$$A_L\frac{dH} {dT} = -Q_t + Q_{gw}$$
$$\frac{dQ_{gw}} {dt} = c_L P_L (H_0 - H)$$
Where:
\(A_L\)
= Area of the lake, acres
H = Lake level, ft
t = time, min
\(Q_t\)
= Flow rate through the turbines,
\(ft^3/sec\)
\(P_L\)
= Perimeter of the lake, ft
\(Q_{gw}\)
= Groundwater recharge flow rate,
\(ft^3/sec\)
\(H_0\)
= Reference head for Darcy type flow, ft
\(C_L\)
= Coefficient describing Darcy law hydraulic conductivity,
\(min^{-1}\)
The time step used by Simgua was ‘minutes.;’ volume flows were in acre-ft, levels in ft. The model as displayed by Simgua is shown in Figure 1.
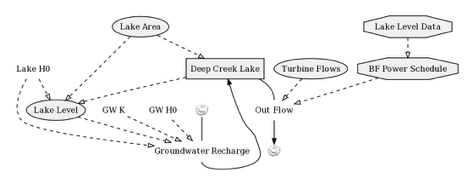
Figure 1 - Simgua Model of the Lake
For a 2,600 minute duration and using the following parameters:
\(A_L\)
= 3,900 acres,
\(Q_t\)
= 2 x 300 cfs,
\(P_L\)
= 65 miles,
\(H_0\)
= 2458ft,
\(C_L\)
= 0.02/min.
Figure 2 shows the predicted time behavior of the lake level.
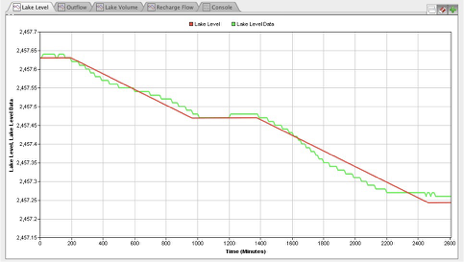
Figure 2 - Predicted Lake Level
The corresponding generator status is shown in Figure 3.
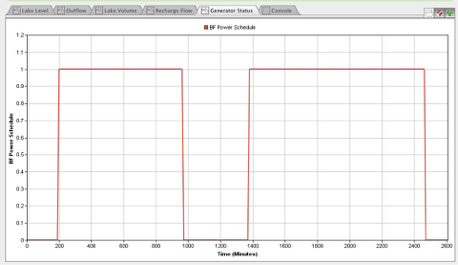
Figure 3 - Generator status for the simulation