Piet's Notes on Deep Creek Lake Science
Sensible Technologies - The Science of Deep Creek Lake
A stage-storage diagram expresses how much water is in the lake at a given water level. The lake is not a cylindrical volume. The shoreline areas slope mostly gradually into the lake. This note describes how the stage-storage curve is constructed using the latest, 2011 DNR, bathymetry data and how it compares with other versions that are found in the literature.
Figure 1 shows a drainage basin, like Deep Creek Lake, as a systems diagram. The drainage basin has inputs and outputs, and water in the system is either transferred or stored.
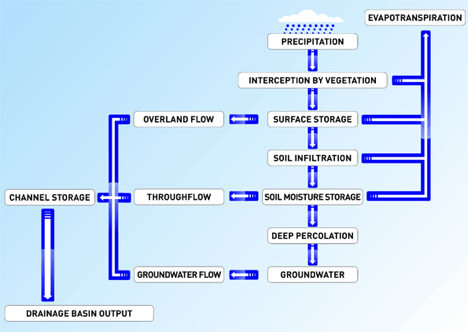
Figure 1 - The Drainage Basin as a Systems Diagram
The following description is adapted from this website.
The main input to Deep Creek Lake is the precipitation on its watershed. The type of precipitation (rain or snow, etc), the intensity, the duration and frequency all have an effect on the amount of water that flows into and is stored in Deep Creek Lake. Each subsystem of the drainage basin system will also have inputs and outputs, and the output from one stage of the diagram will form the input for another.
Water is stored in a drainage basin on the surface in lakes and channels or underground in the groundwater store. Water reaches the groundwater store via the processes of infiltration and percolation. During these processes, some water will be stored in the soil and rock. The amount of water stored will vary depending on the porosity of the soil and on the permeability of the rock. Water can also be temporarily stored via interception. This refers to the storage of water on leaf and plant stems. Dense foliage may result in little water reaching the ground, since it often evaporates from the leaves.
The sum of all the water flowing over the drainage basin’s surface is called runoff. It is made up of streamflow, which is flow through permanent creek channels and overland flow or surface runoff. Overland flow transfers water through the basin either as sheet-wash, across the surface, or in tiny channels called rills. Beneath the surface, water is transferred via through-flow, which is the movement of water through the lower soil towards creeks, and groundwater flow. Groundwater flow is typically very slow. Water that has been intercepted by foliage may also be transferred, either directly as through-fall, or by running down branches and stems via stem-flow.
The final release of the water in a drainage basin is known as its output. Typically, creeks flowing into rivers and eventually the sea will be the main output of a drainage basin. At Deep Creek Lake the ‘river’ is the release through the hydroelectric generators into the Youghiogheny river. Some water will also be lost via evapotranspiration. This process refers to direct evaporation, and also to the extent that moisture lost from leaves will result in plants withdrawing water from the soil via their roots. In addition, there is seapage around the dam.
The net amount of water stored in the lake is generally controlled by operating the hydroelectric turbines. The drop in the water level of the lake by the fixed amount of water used by the hydroelectric facility is a function of the water level of the lake. To be able to assess how much drop in the water level occurs requires a knowledge of the amount of water in the lake as a function of lake level. A stage-storage diagram, as its usually called, shows that dependency.
Figure 2 shows the stage storage diagram as computed from the data DNR collected in the spring of 2011. On that figure are also shown two other statge-storage curves that were found in the open literature.
Shown in Figure 3 are the data from the 1963 FPC license application #2370, while Figure 4 shows the data reported in Figure 2-8 in one of the many Brookfield reports. Note that the volume in the last two figures is in different units.
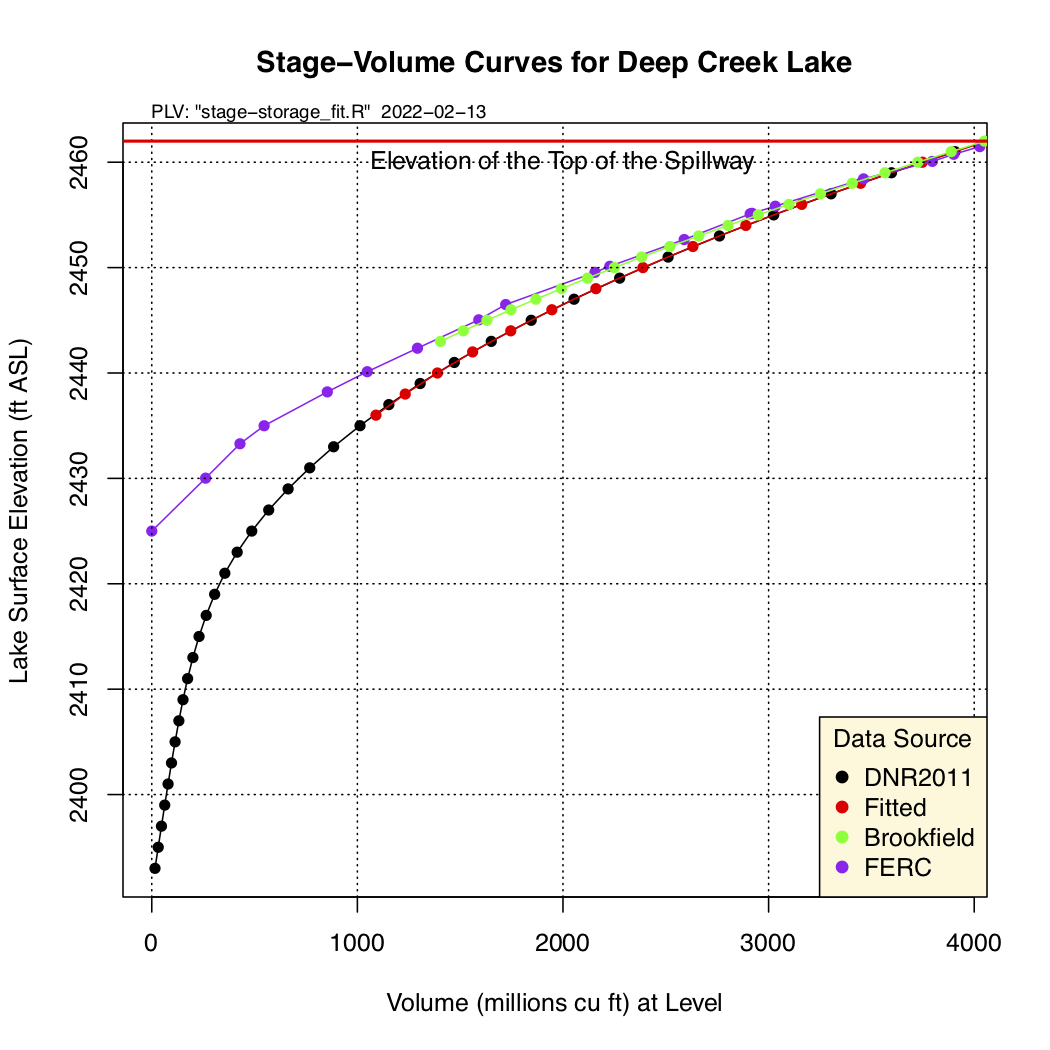
Figure 2 - The Stage-Storage Curves for DCL
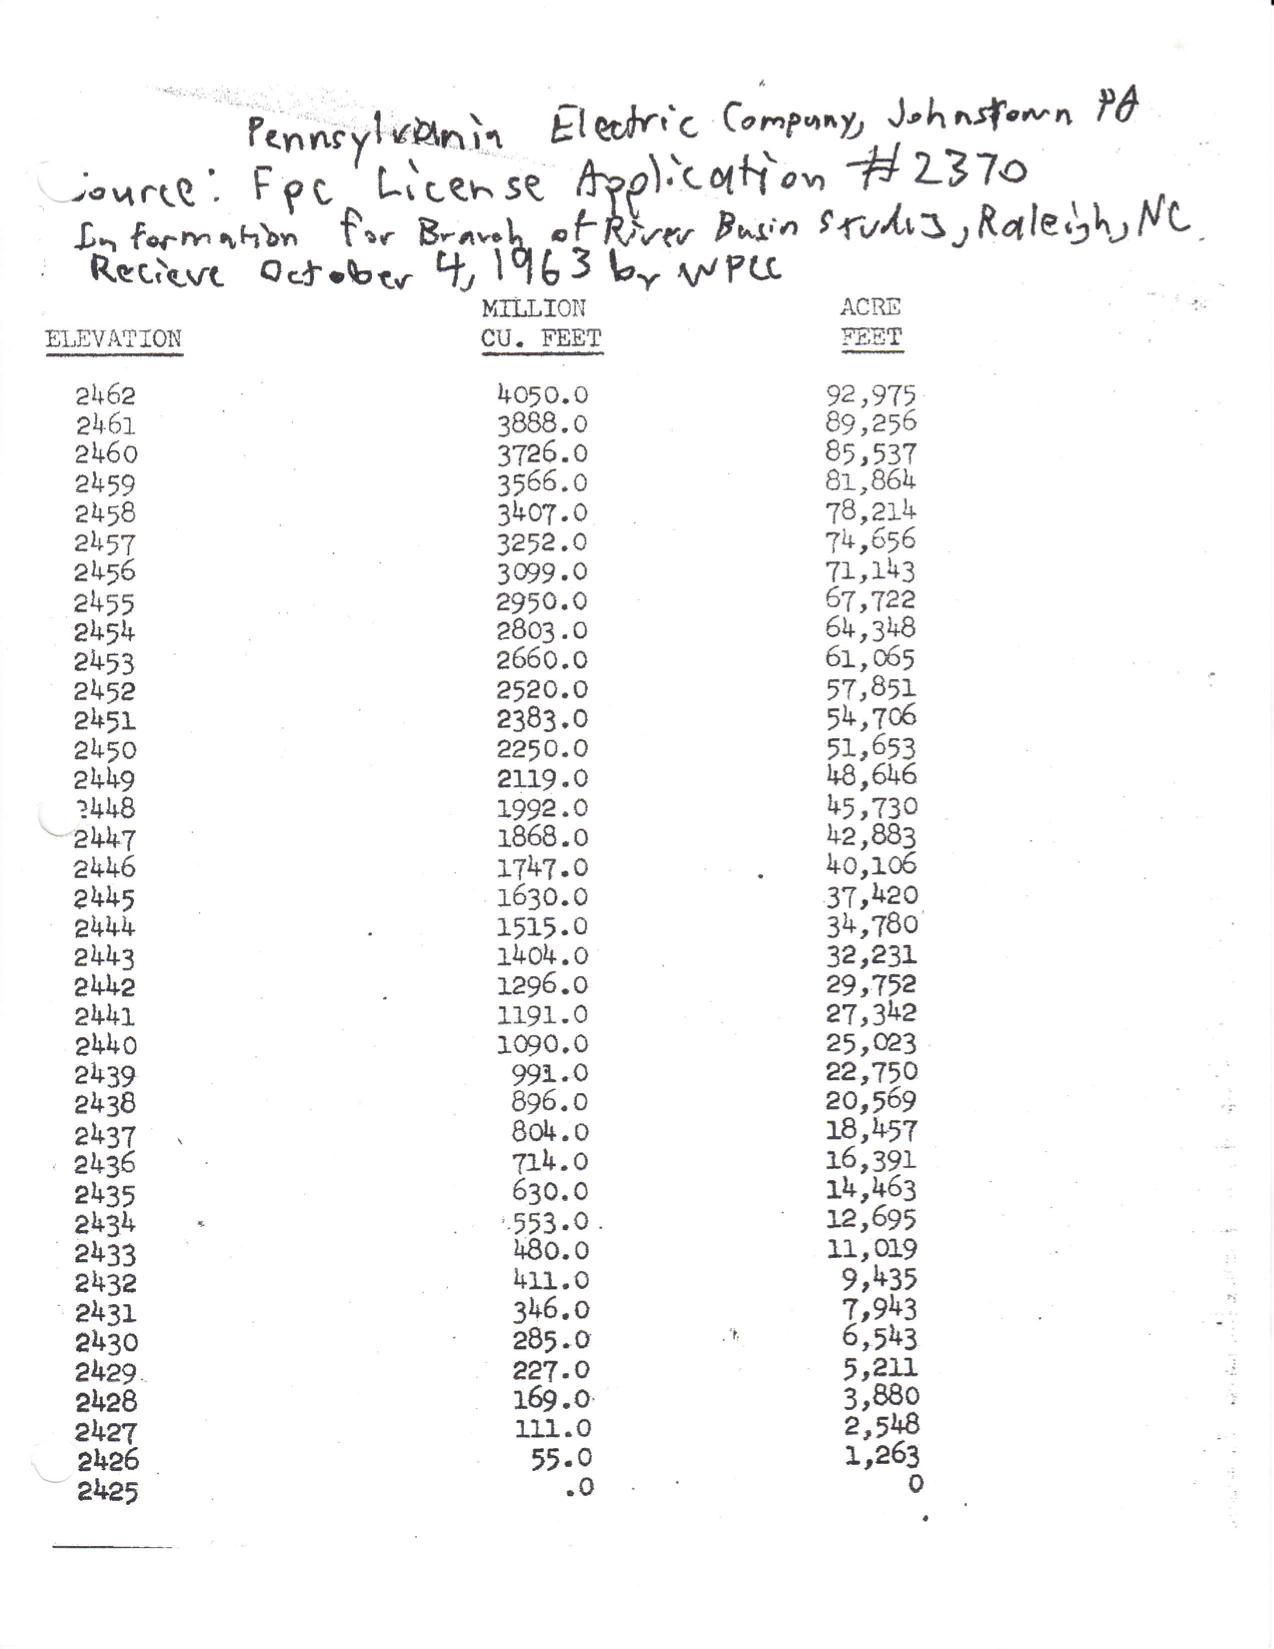
Figure 3 - The Data from the 1963 FPC License Application
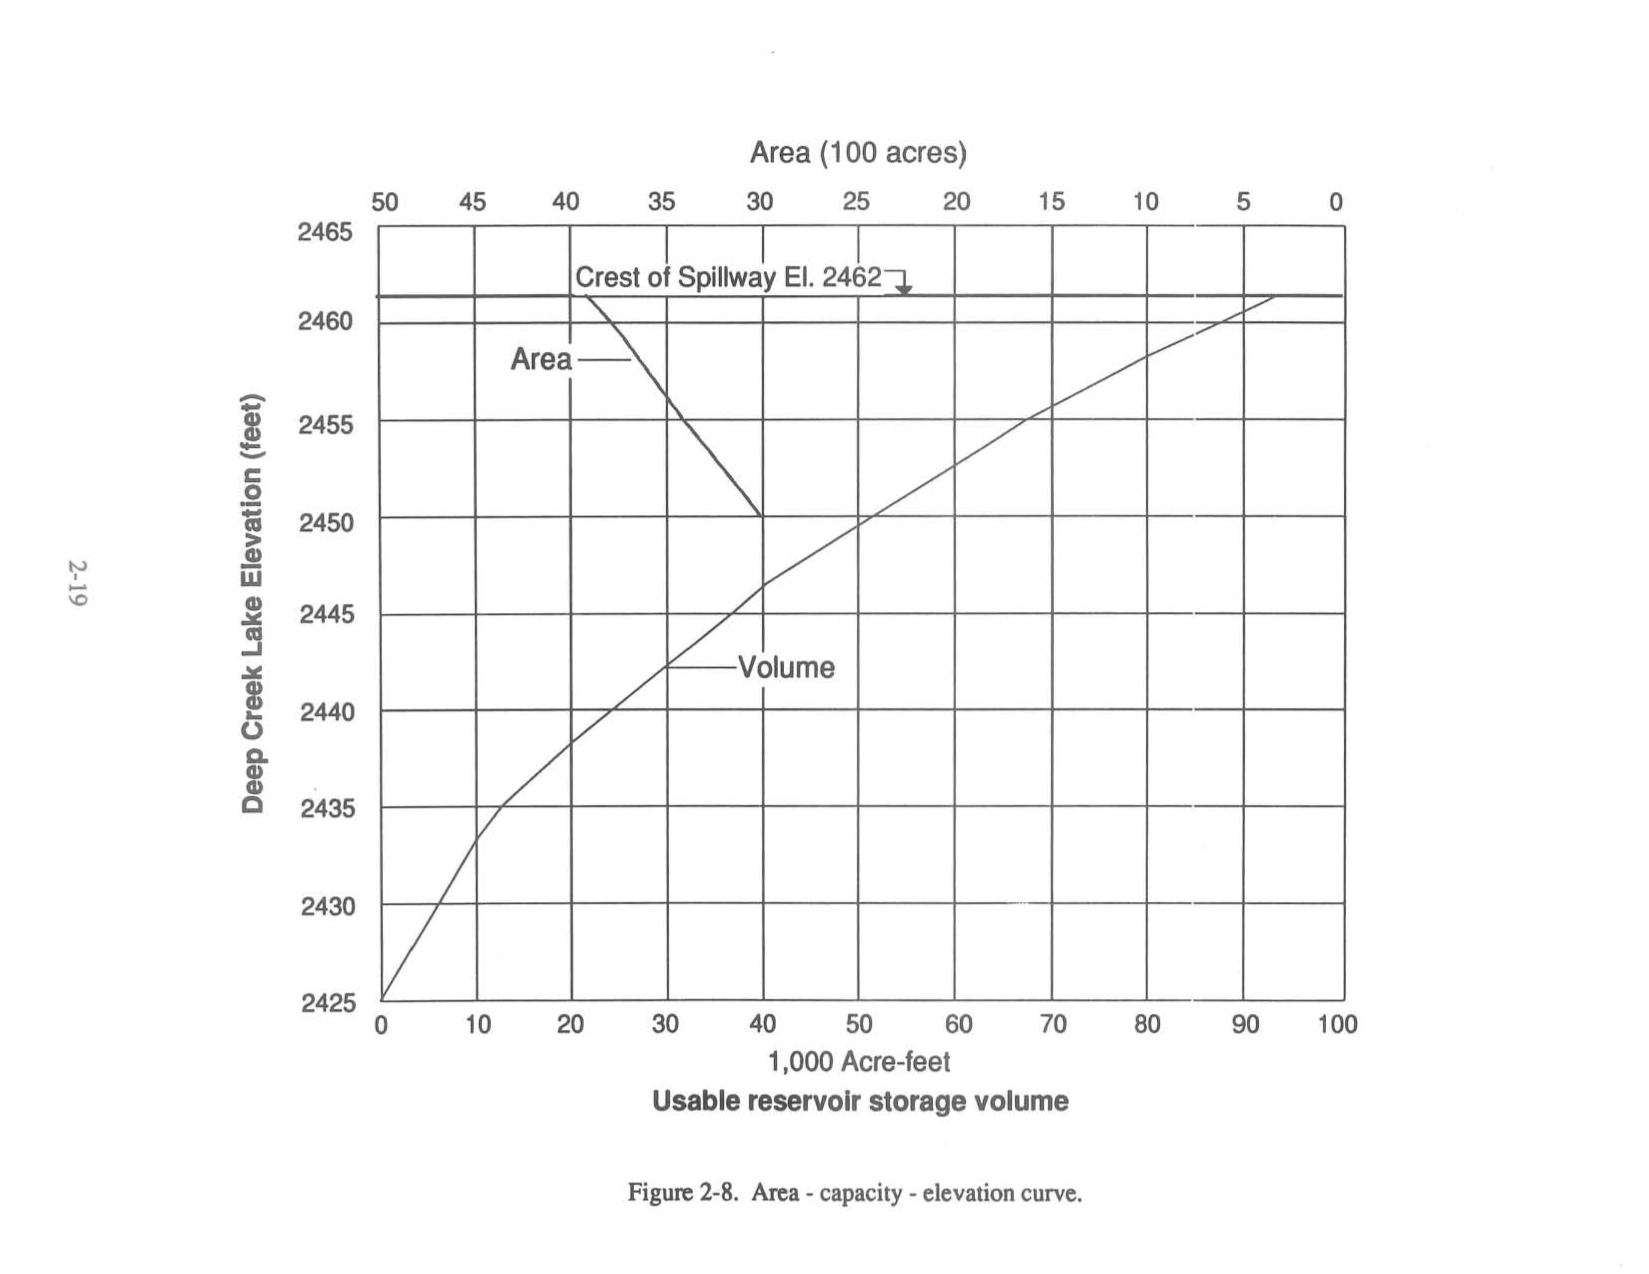
Figure 4 - The Data from Figure 2-8 of Brookfield's 1994 Report
Figures 5 and 6 show the literature data as they have been digitized. Note that the x-axes have different units.
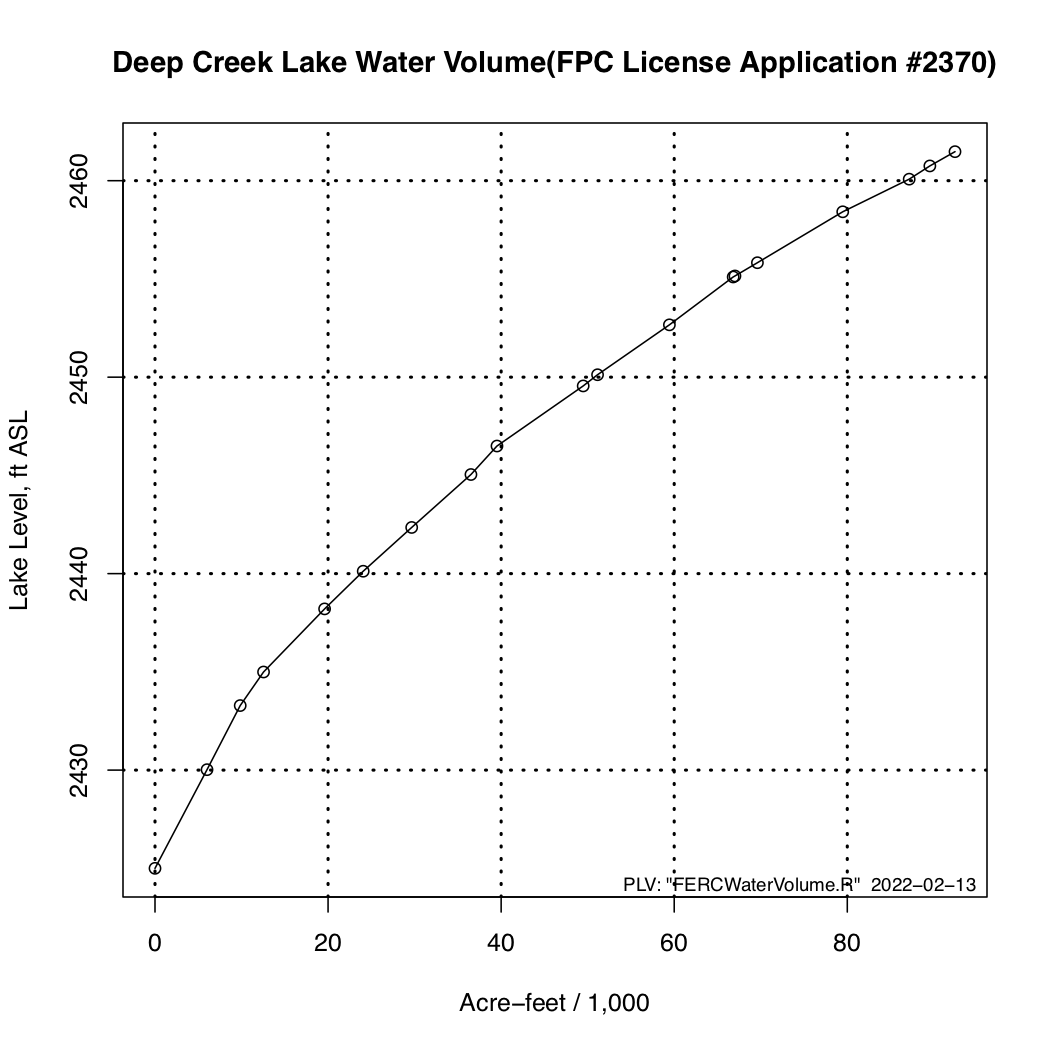
Figure 5 - The Data from Figure 3 above Digitized.
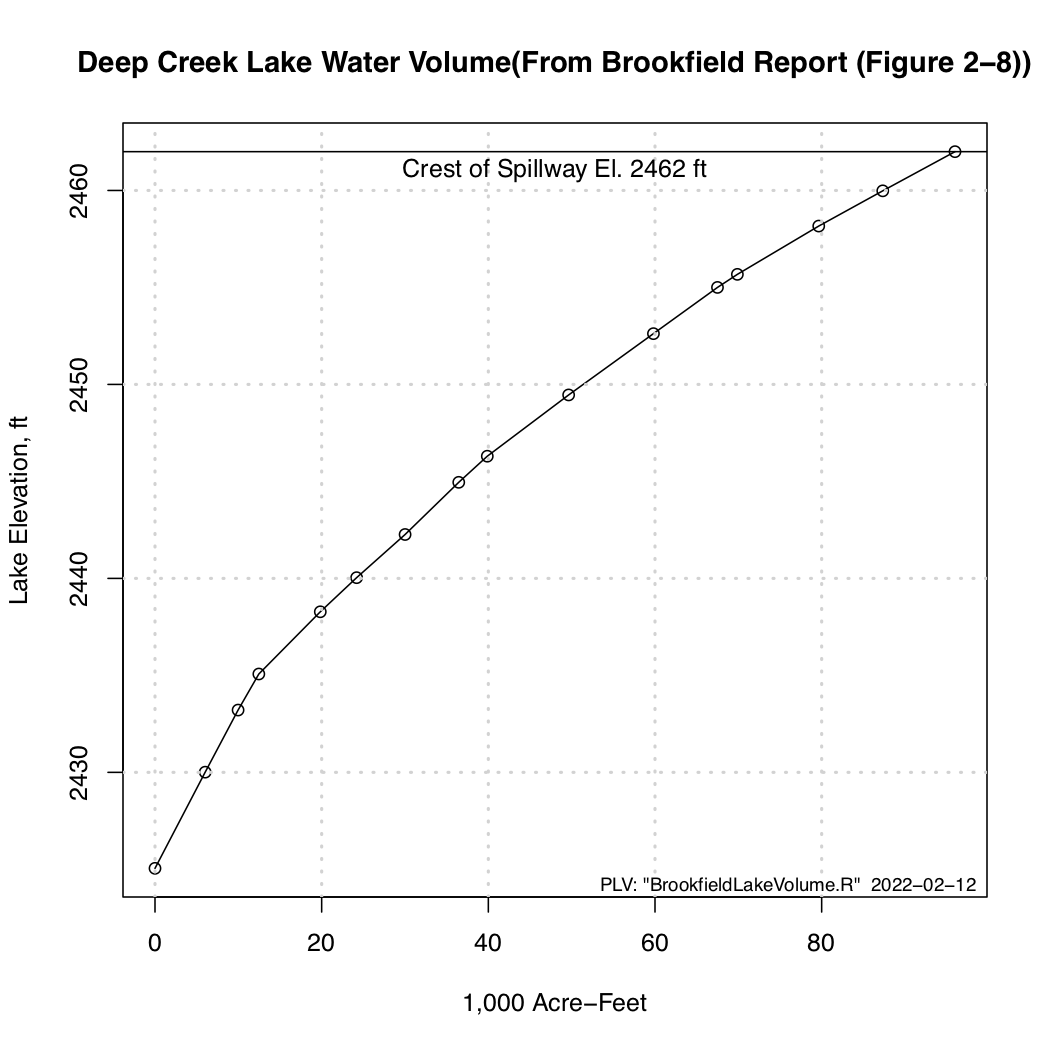
Figure 6 - The Data from Figure 4 above Digitized.
The methodology applied to create the stage-storage diagram from the 2011 DNR bathymetric data is similar to the one used to develop the bathymetric maps.
The lake area was overlaid with a grid of square cells for which an average depth was computed using Akima’s interpolation procedure for irregularly spaced data (using the DNR data). Next, at two foot depth intervals, the number of cells whose depth fall above the appropriate levels were calculated, and knowing the cell areas, its straight forward to calculate the total area above those lake levels. Next, these areas were integrated with respect to the two-foot interval depth values, using the trapezoidal rule, giving the water volumes above the appropriate water levels. These results are plotted in Figure 2.
Note that the three sets of data, DNR, PFC and Brookfield shown in Figure 2, agree very well down to a lake level of about 2,450 ft, after which they diverge somewhat. Below 2,450 ft the results are not that important for the various projects reported on this website.
It is not clear why there is a difference at lower levels, because it should have been known that there is water in the lake at levels less than the last entry in their table, 2,425 feet of elevation (the bathymetry shows that there is water down to 2,387 ft). Perhaps the table expresses the usable quantity of water for the hydroelectric facility, since coincidentally (?) the lowest level listed in the FPC data is about the same as the level of the water at the top of the power tunnel intake that leads to the turbines (See Figure 7).
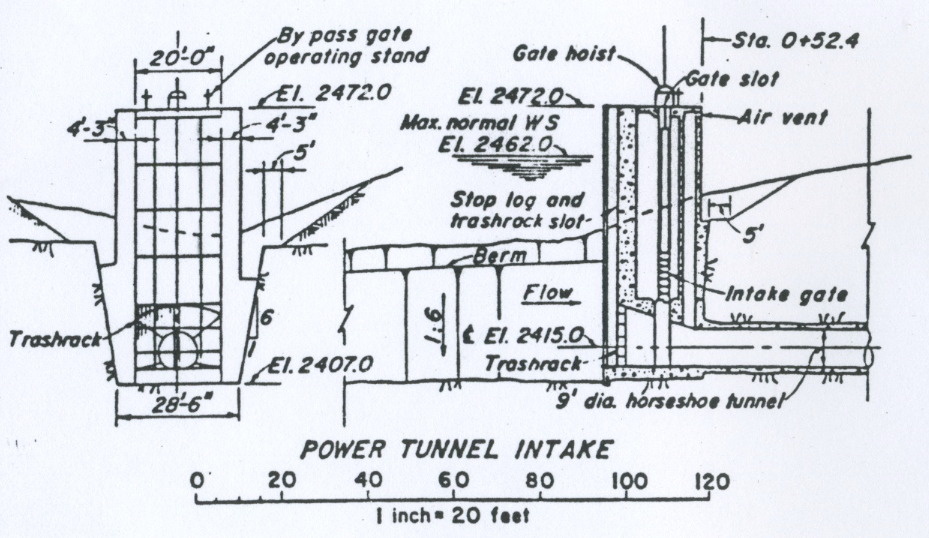
Figure 7 - Schematic of the Power Tunnel Intake.
The lake volume as a function of the lake level (level > 2445 ft) is given by the following expression:
$$$$
{{> V = Lake Volume, acre-feet <}}
{{> L = Lake Level, ft ASL <}}
Figure 8 shows the same stage-volume curves as in Figure 2 except that the x-axis shows the volume in 1000s of acre feet.
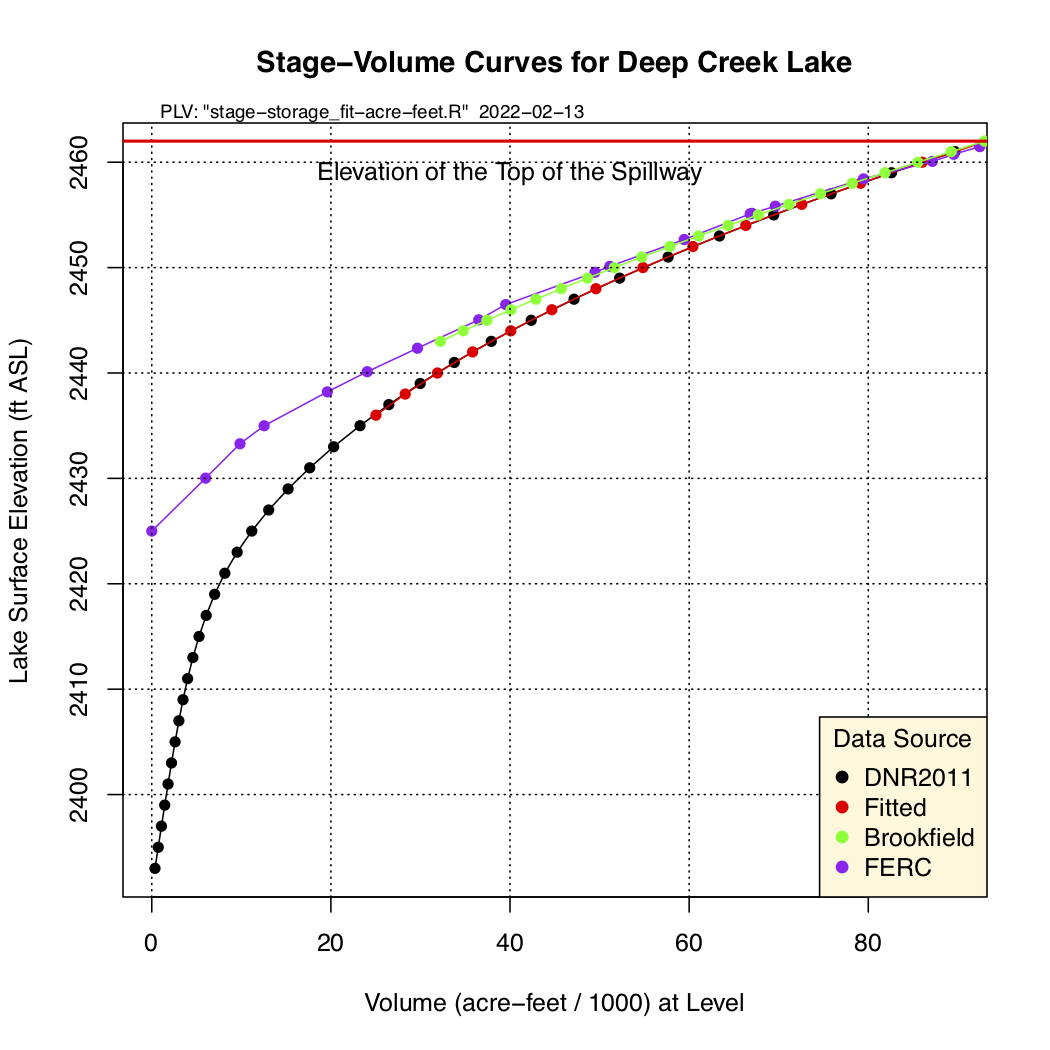
Figure 8 - Stage Volume Curves in Acre-feet/1000.