Piet's Notes on Deep Creek Lake Science
Sensible Technologies - The Science of Deep Creek Lake
This note is about the MBA (Multi-level B-spline Approximation) method. From the R documention this is what it the function call says:
Surface approximation from bivariate scattered data using multilevel B-splines
Description
The function mba.surf returns a surface approximated from a bivariate scatter of data points using multilevel B-splines.
Usage
mba.surf(xyz, no.X, no.Y, n = 1, m = 1, h = 8, extend=FALSE,
sp=FALSE, …)
The first variable is a matrix or a dataframe with x, y and z columns. basically the x, y, and z values of the scattered points. Alternative one can provide a SpatialPointsDataFrame object.
no.X = resolution of the approximated surface along the x axis. It’s assumed that this is the number of equally spaced points along the x-axis of the output grid.
no.Y = resolution of the approximated surface along the y axis. It’s assumed that this is the number of equally spaced points along the y-axis of the output grid.
There are some other setting that basically take care of duplicate data. I have not found them to be needed.
Figure 1, 2 and 3 show the results from one of the data sets that is available via the ‘akima’ package. The data package includes five test sets that were originally put together by Franke as a testbed for his development efforts. The data sets are also described here.
Figure 1 uses a grid spacing of 40 intervals similar to the Akima interpolation problem.
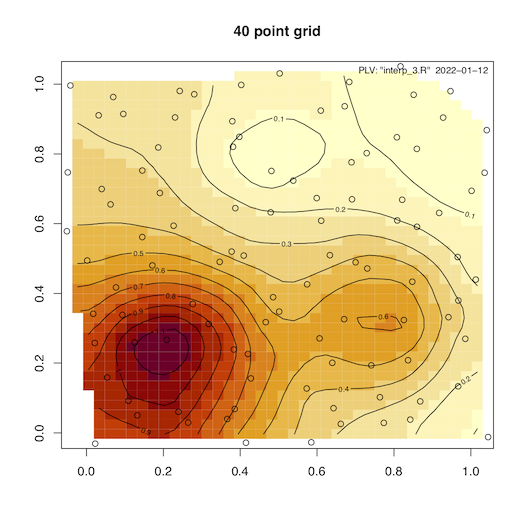
Figure 1 - MBA - With 40 interval grid spacing.
Figure 2 is with 200 grid points in both x and y direction.
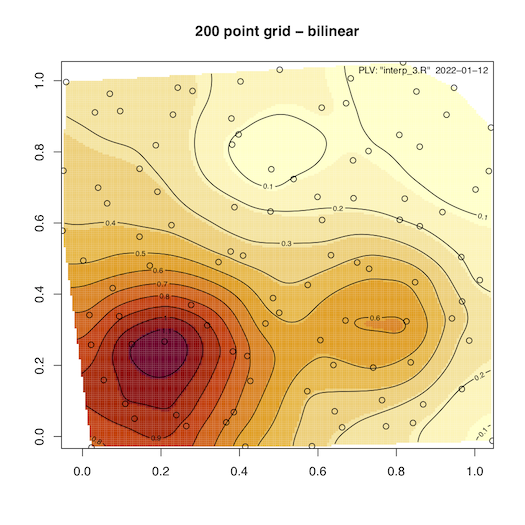
Figure 2 - MBA - With 200 point grid spacing.
The method is based on the following two references:
1. Scattered Data Interpolation with Multilevel B-Splines
2. Approximation of Scattered Data with Multilevel B-splines
PLV
First published: 01/12/2021
The full script that generated the images in this note can be found here.