Piet's Notes on Deep Creek Lake Science
Sensible Technologies - The Science of Deep Creek Lake
To create bathymetric maps showing depth contours requires a method for interpolating the measured depths. Elsewhere on this website, possible interpolation methods have been discussed.
Here a comparison of three schemes is presented. The schemes, in order of preference are:
1. Akima
2. MBA
3. Loess
The results of the interpolation are presented in three forms:
1. All of the measured data is used
2. Every 5th measured data point is used
3. Every 10th measured data point is used
The comparisons are shown for one cove, Chadderton Cove, because the results would otherwise be to repetitive.
Akima is probably the most accurate because it goes through the data points. MBA provides a more smoother display of the contours and also goes though all the data points. Loess does the smoothing a bit too much, but still provides generally pleasing images.
The contours for Chaddington Cove, using all of the available data points are shown in Figures 1, 2, and 3.
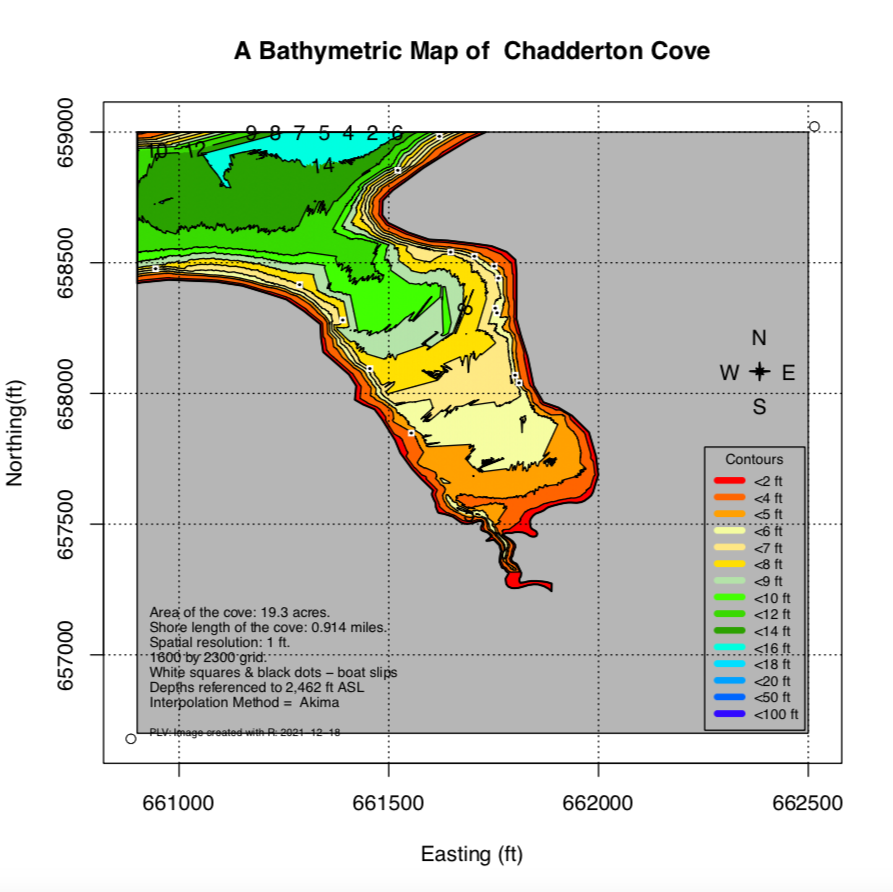
Figure 1 - Map showing the contours generated with Akima.
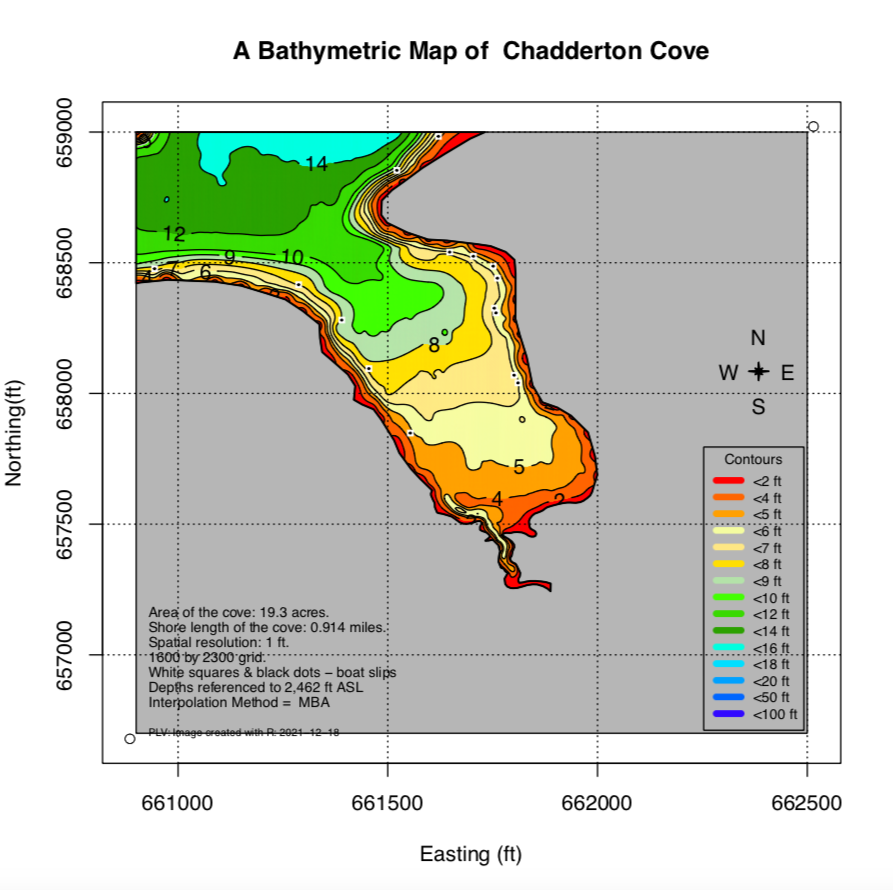
Figure 2 - Map showing the contours generated with MBA.
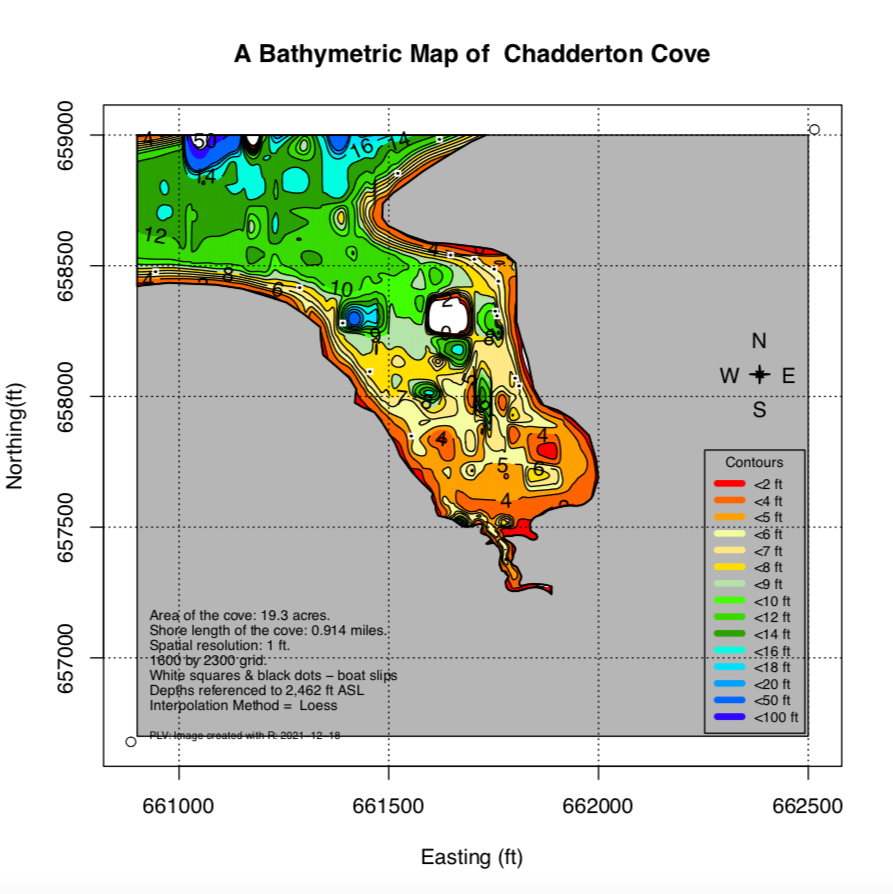
Figure 3 - Map showing the contours generated with Loess.
The contours for Chaddington Cove, using every 5th of the available data points are shown in Figures 4, 5, and 6.

Figure 4 - Map showing the contours generated with Loess.
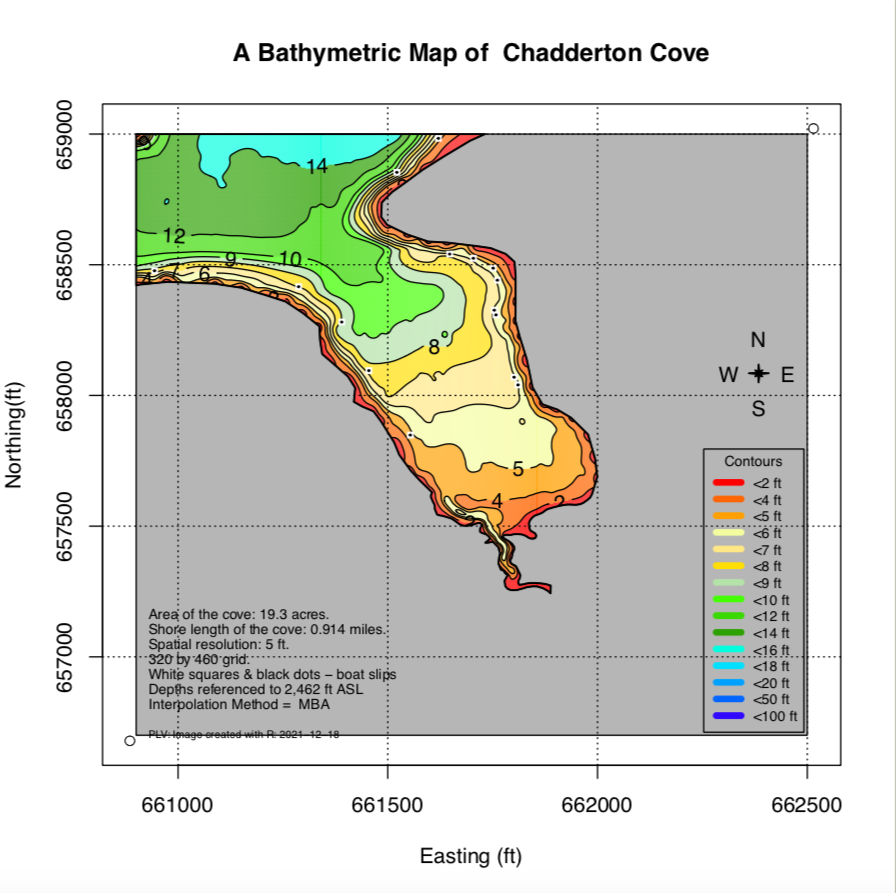
Figure 5 - Map showing the contours generated with Loess.
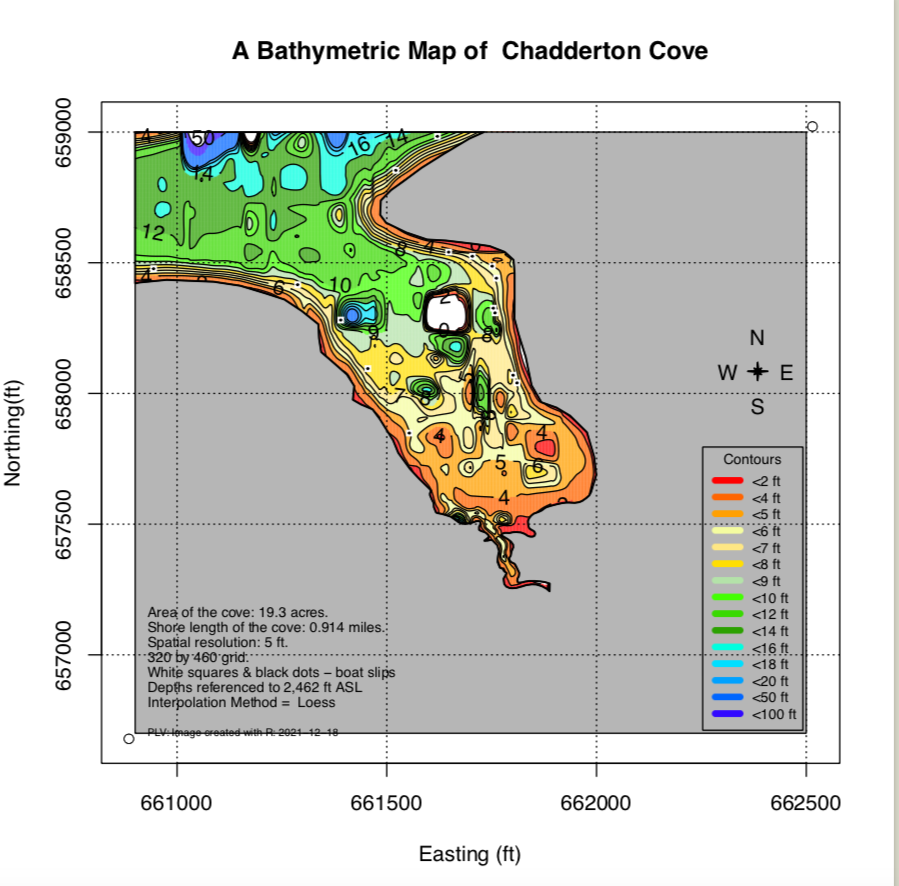
Figure 6 - Map showing the contours generated with Loess.
The contours for Chaddington Cove, using every 10th of the available data points are shown in Figures 7, 8, and 9.

Figure 7 - Map showing the contours generated with Akima.
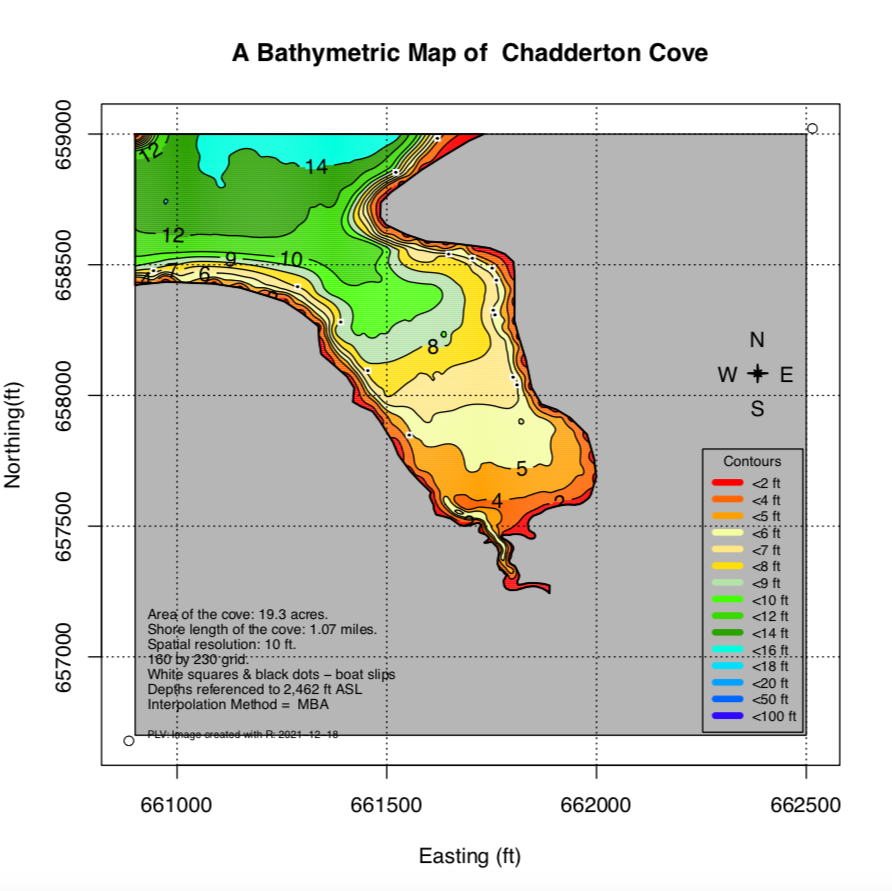
Figure 8 - Map showing the contours generated with Akima.

Figure 9 - Map showing the contours generated with Loess.
Note that Akima and MBA interpolations are similar, but Loess is quite dissimilar.
PLV
First Published: 2021-12-18