Piet's Notes on Deep Creek Lake Science
Sensible Technologies - The Science of Deep Creek Lake
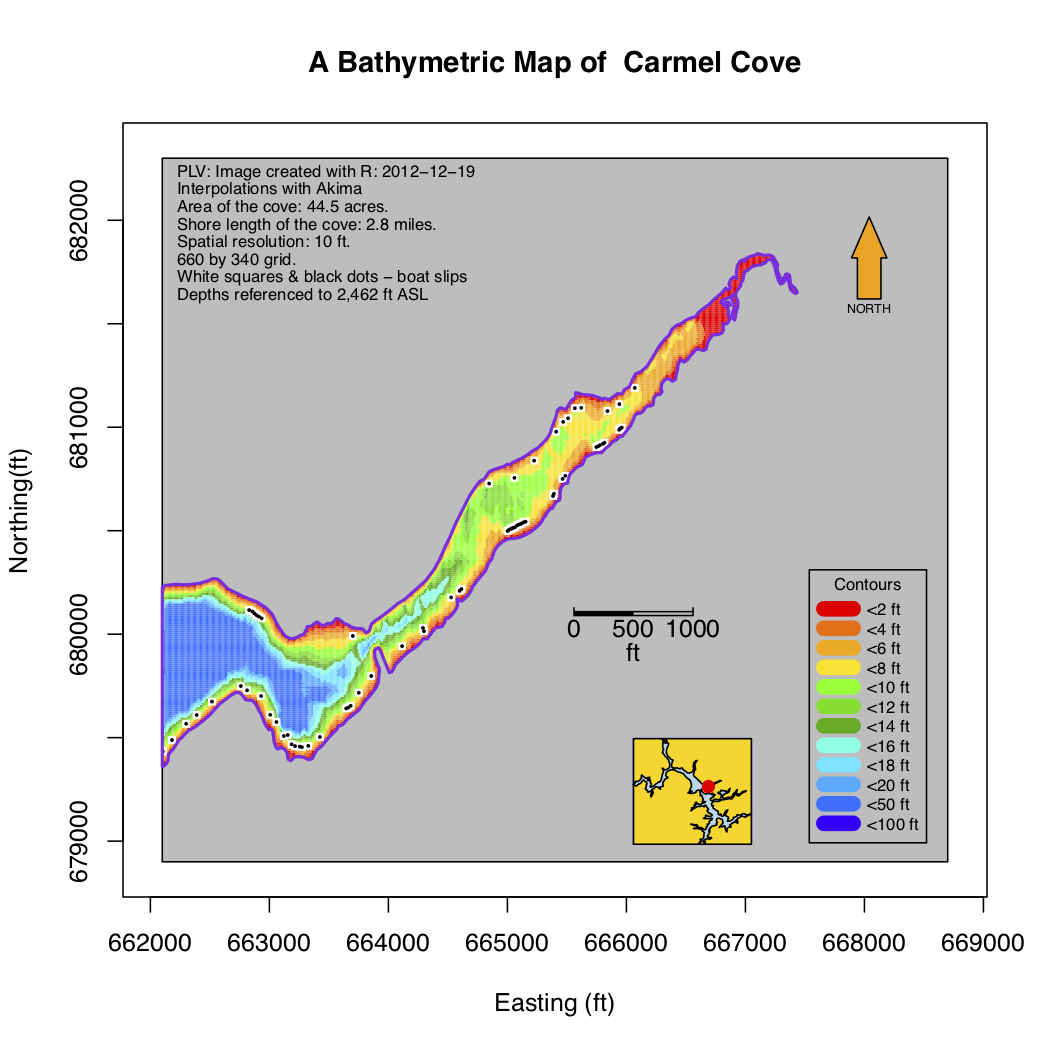
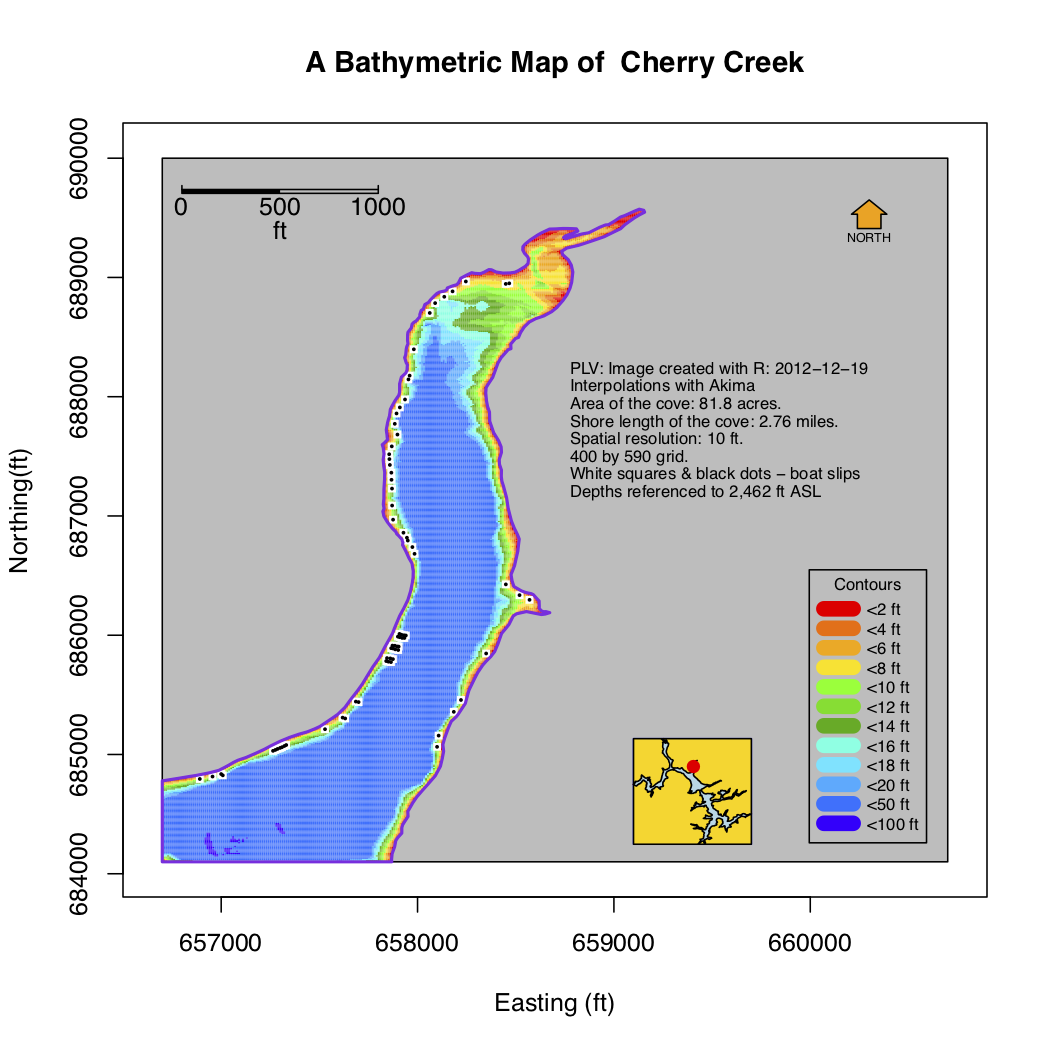
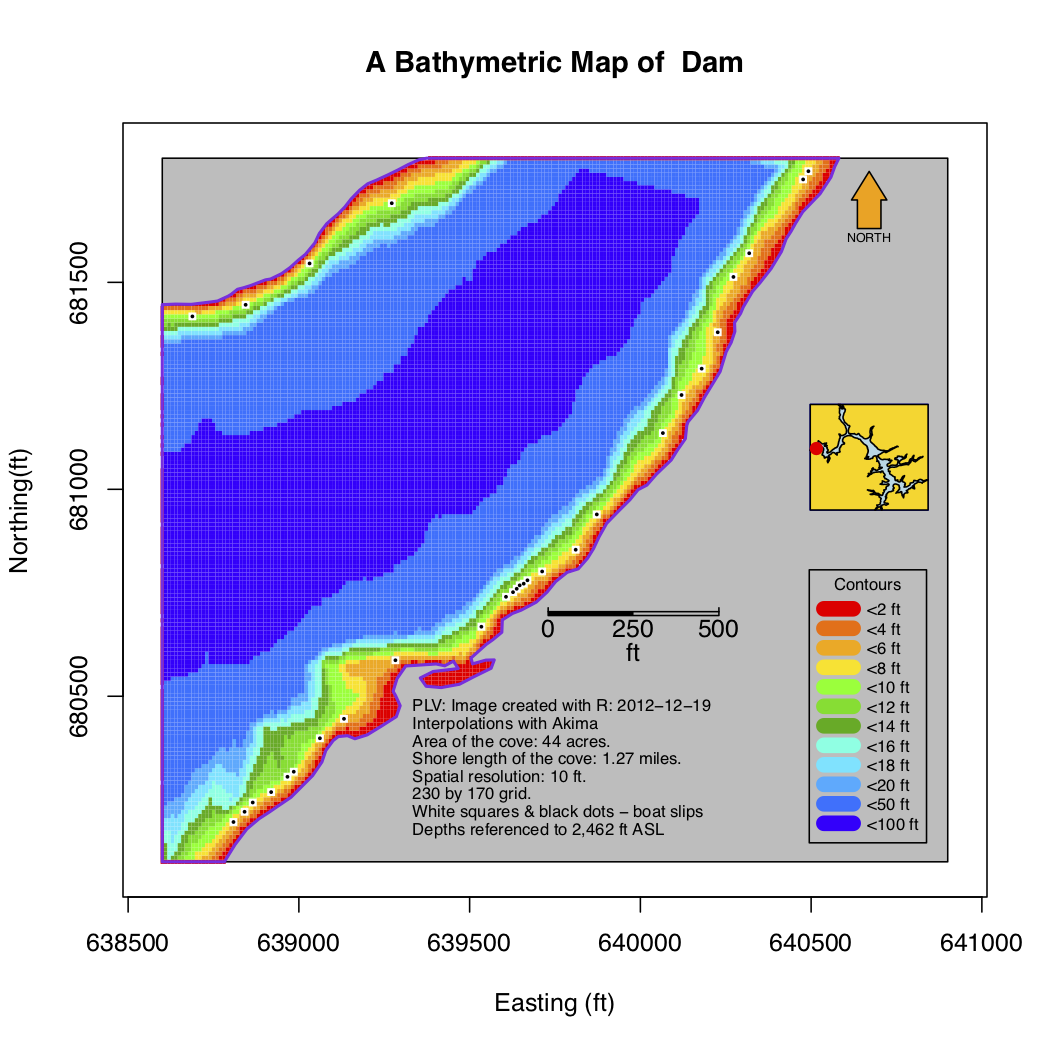
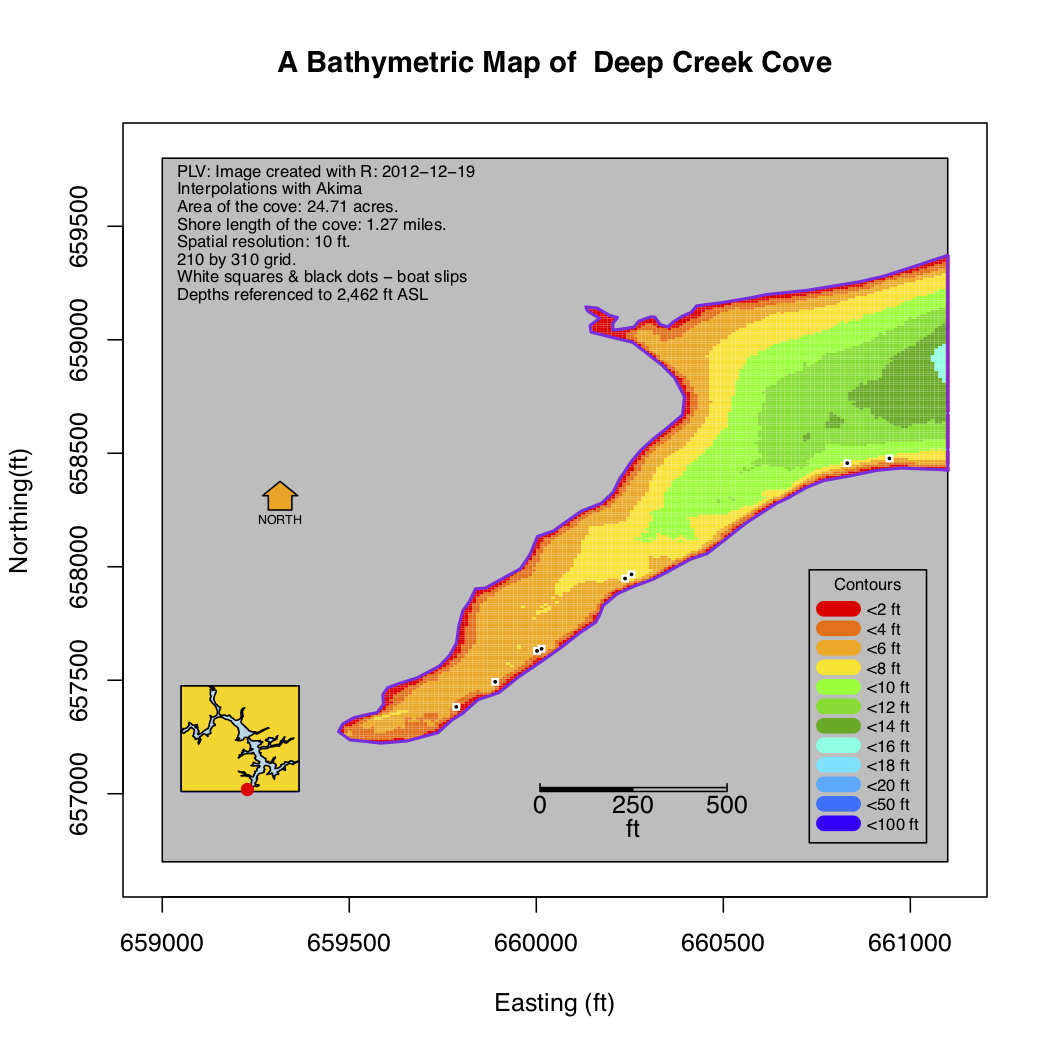
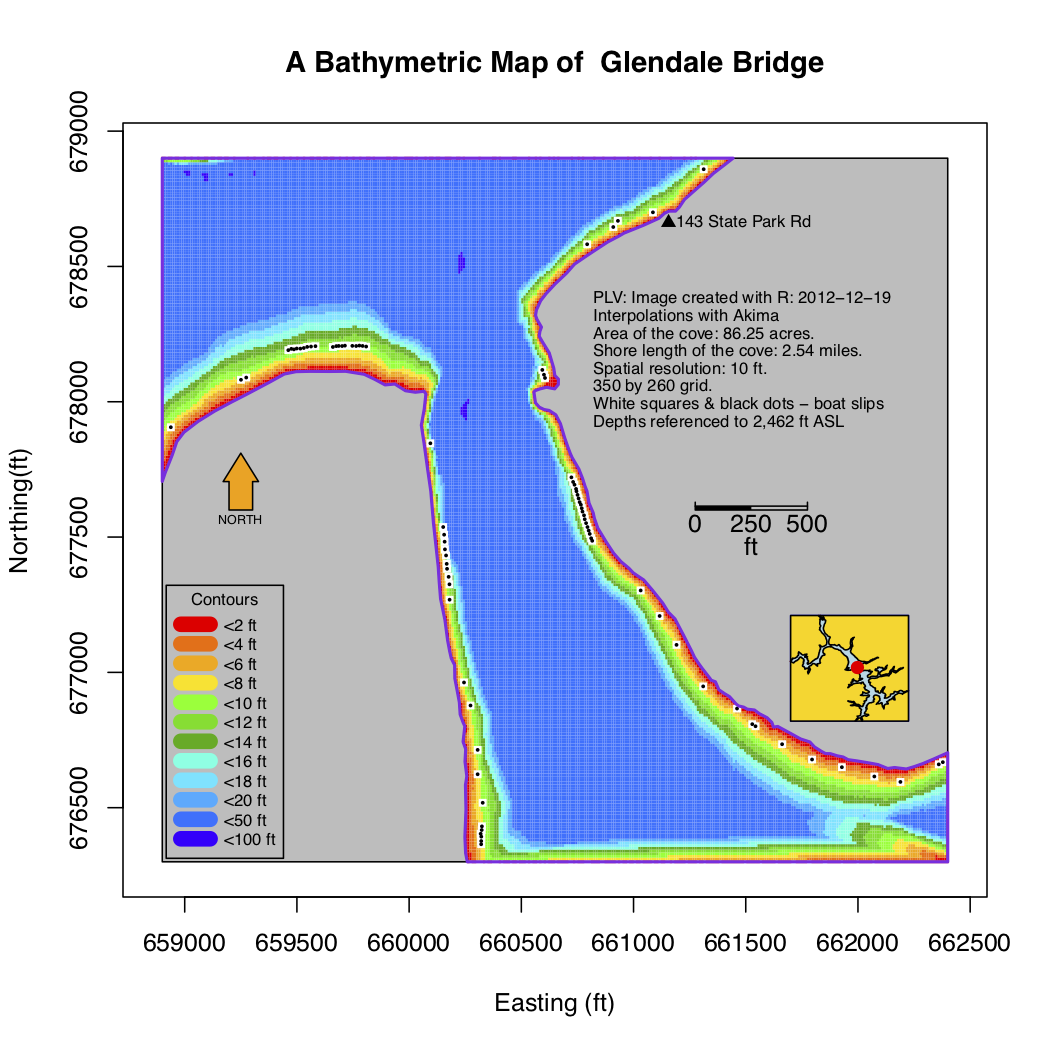
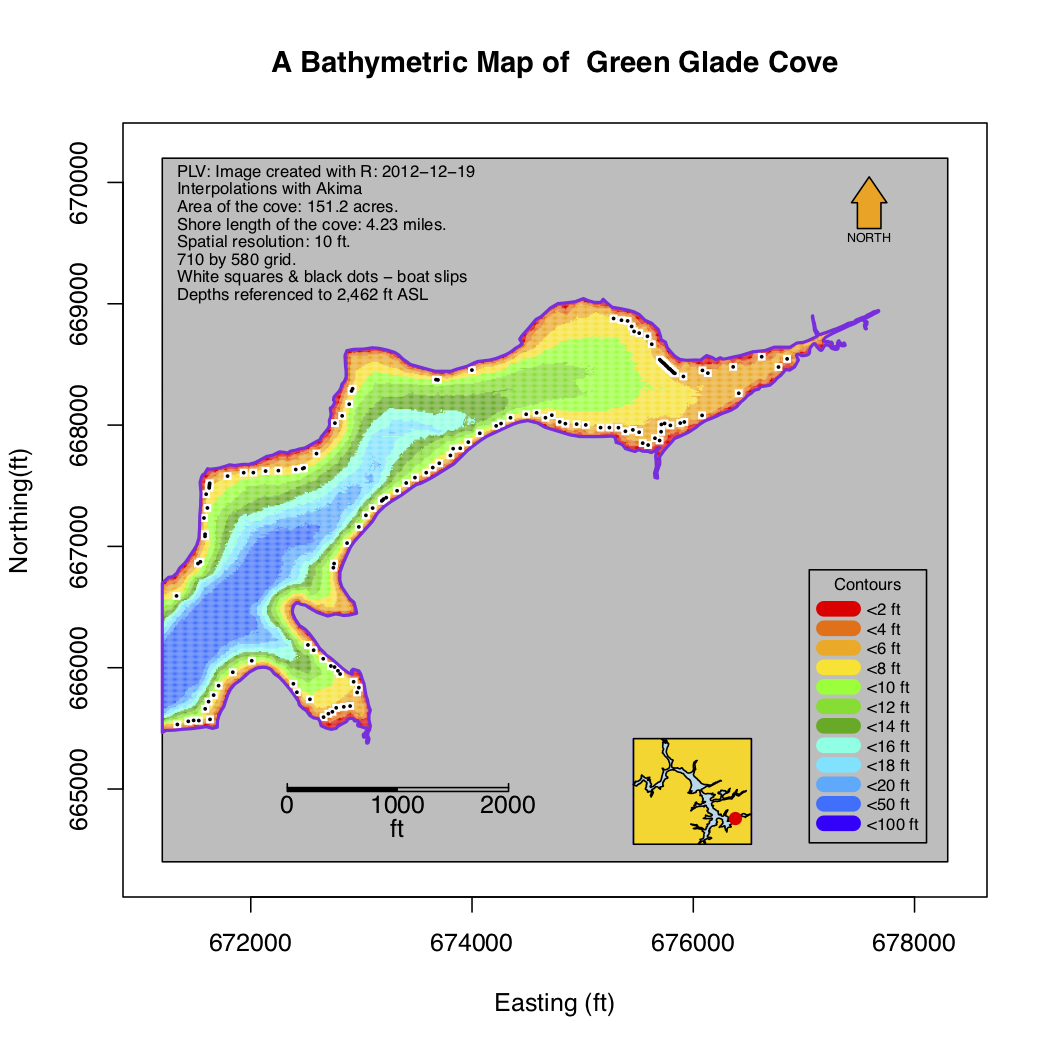
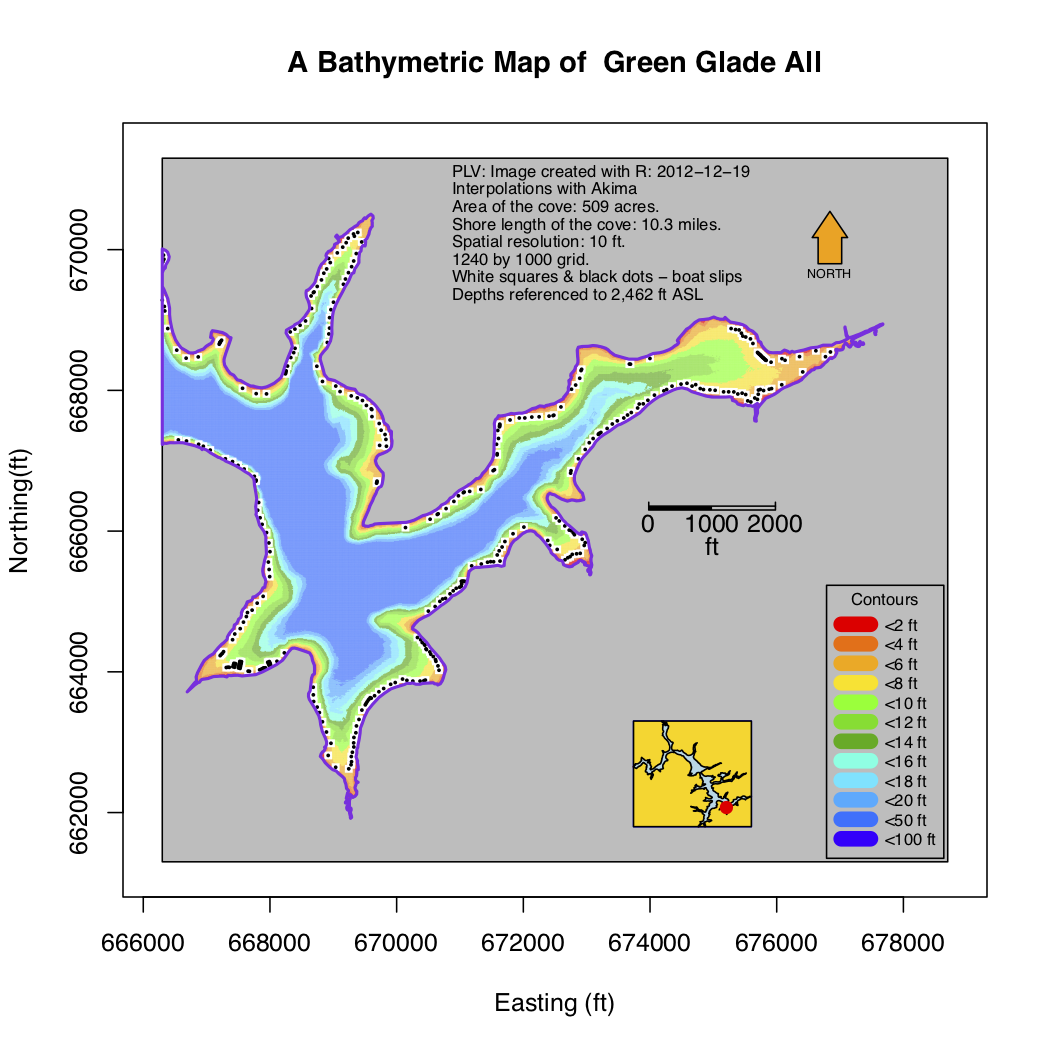
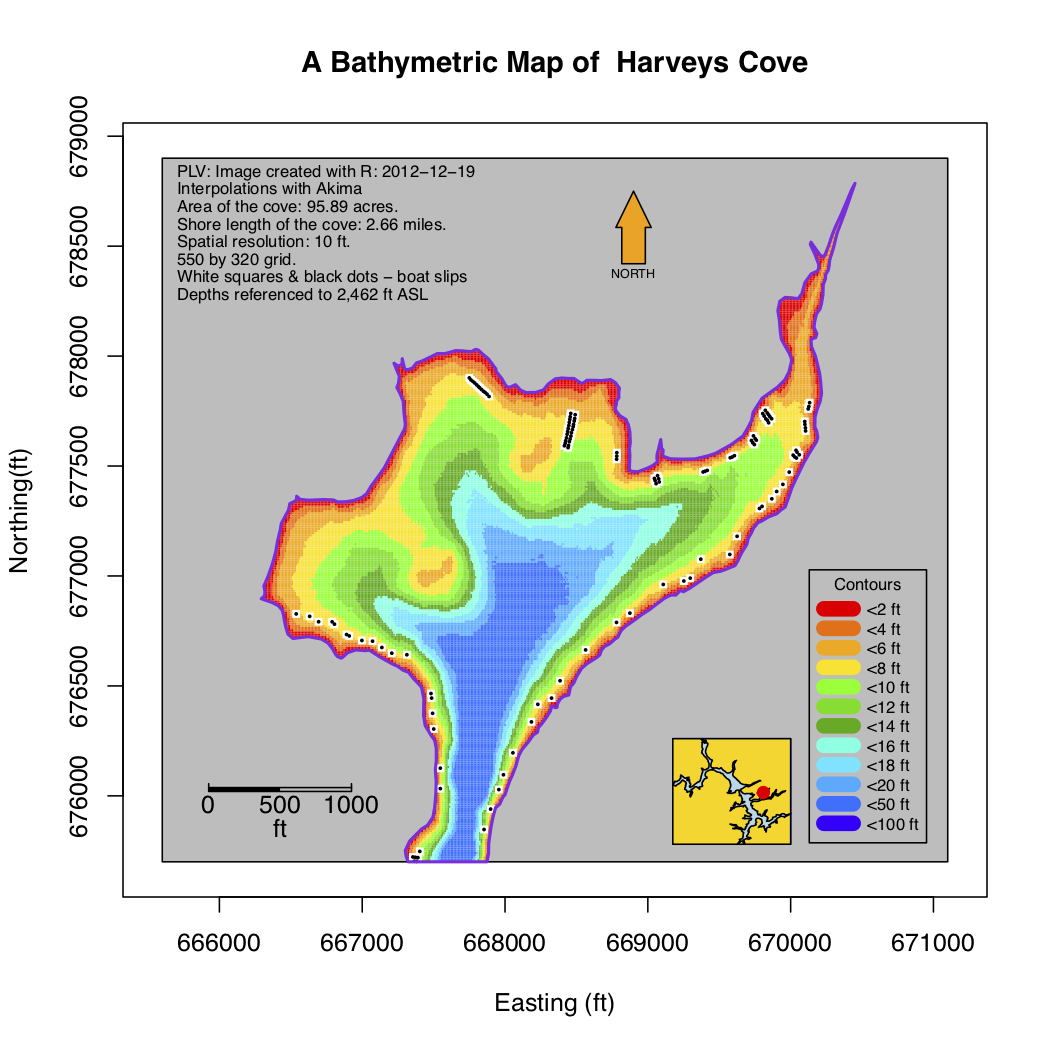
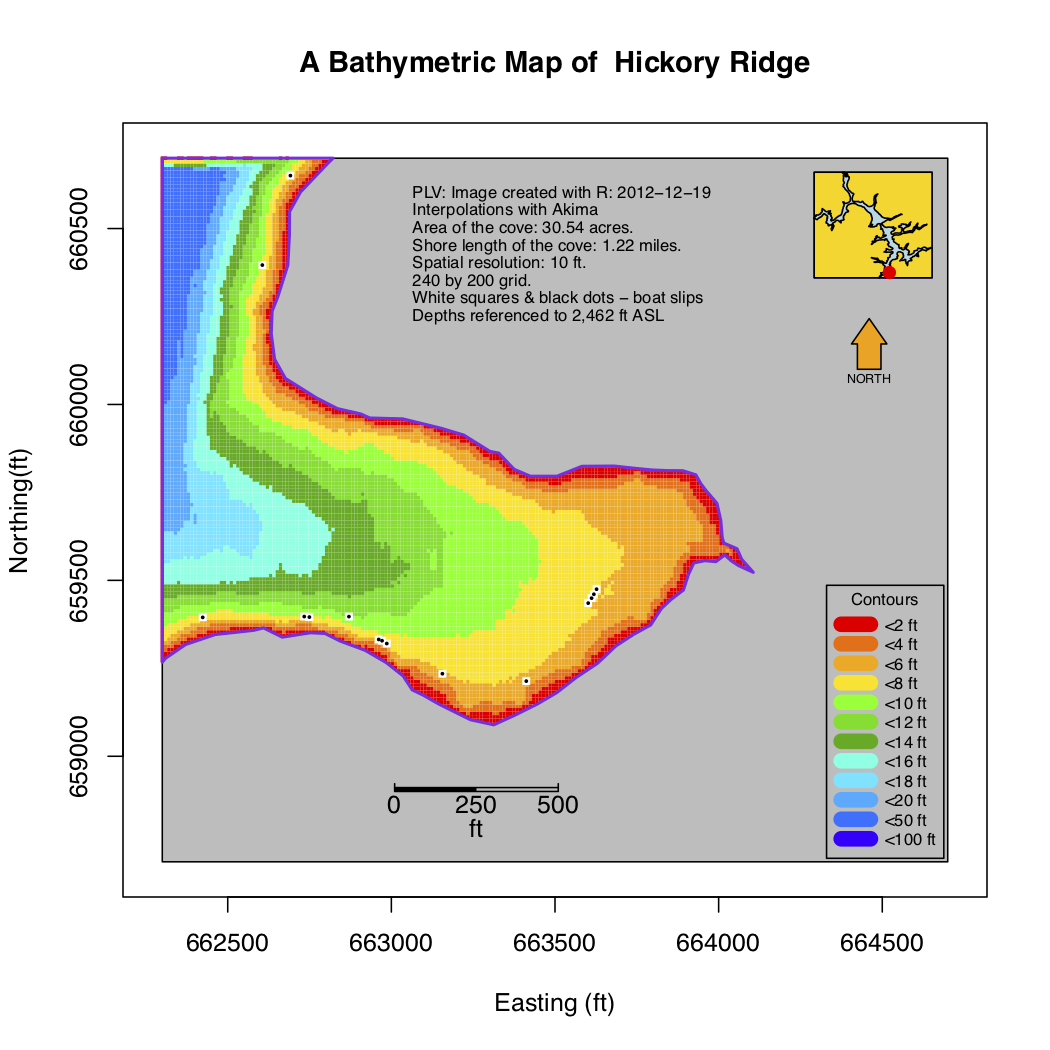
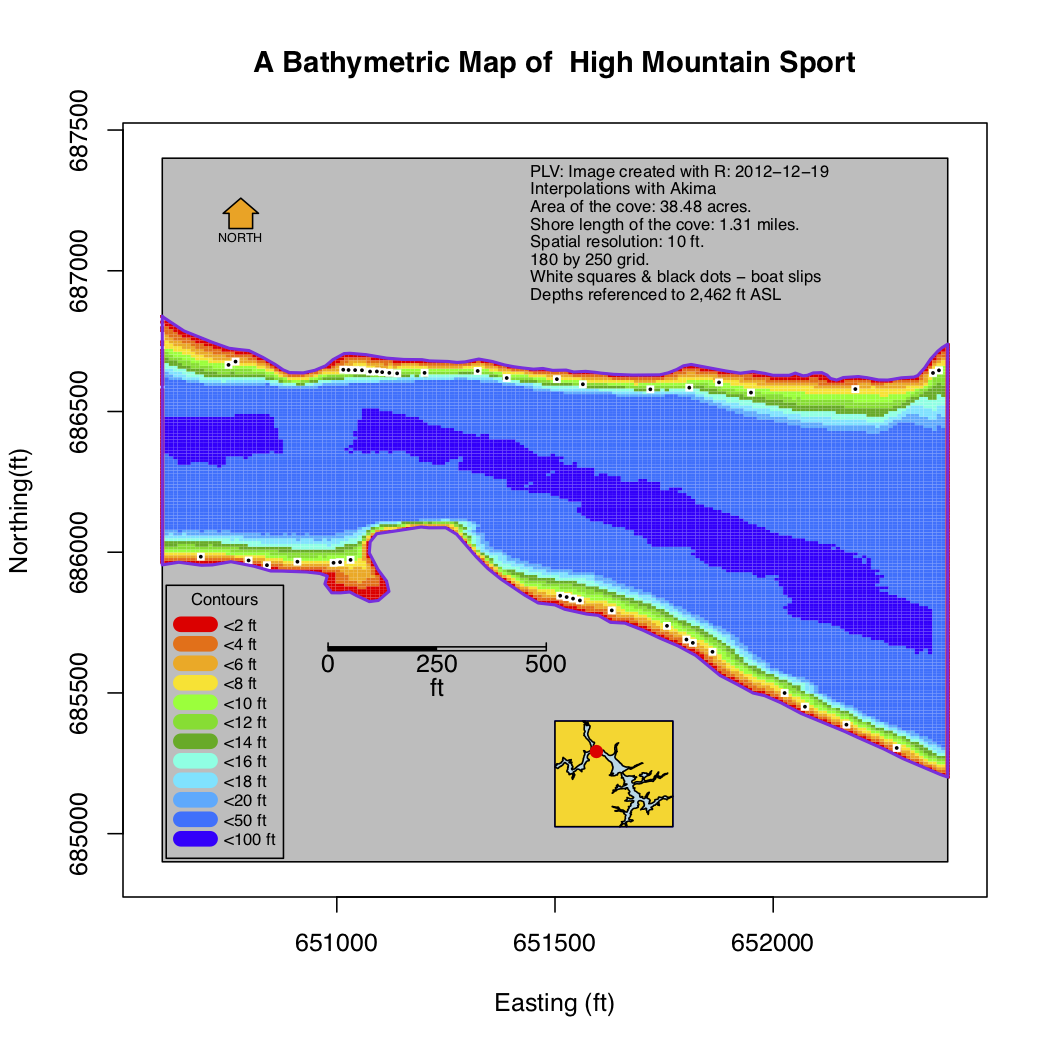
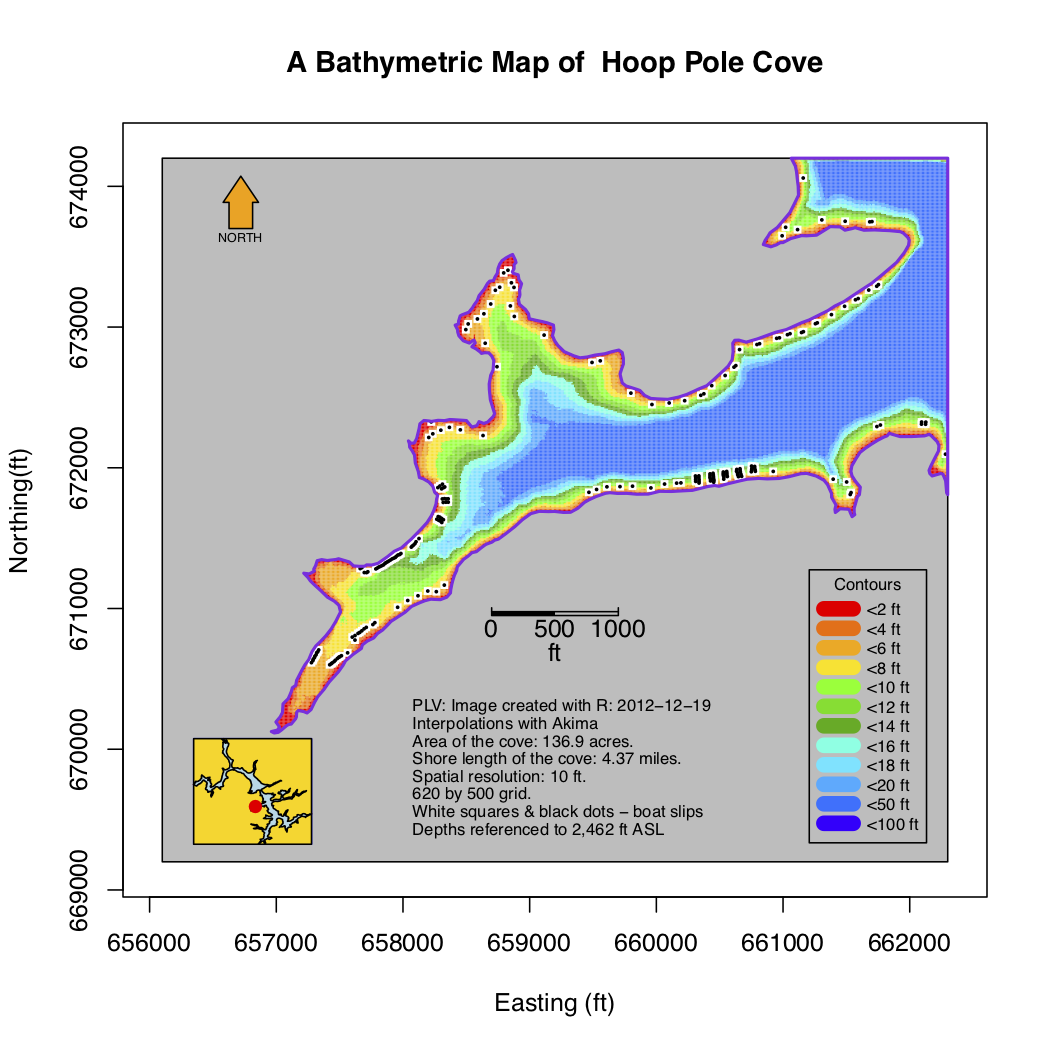
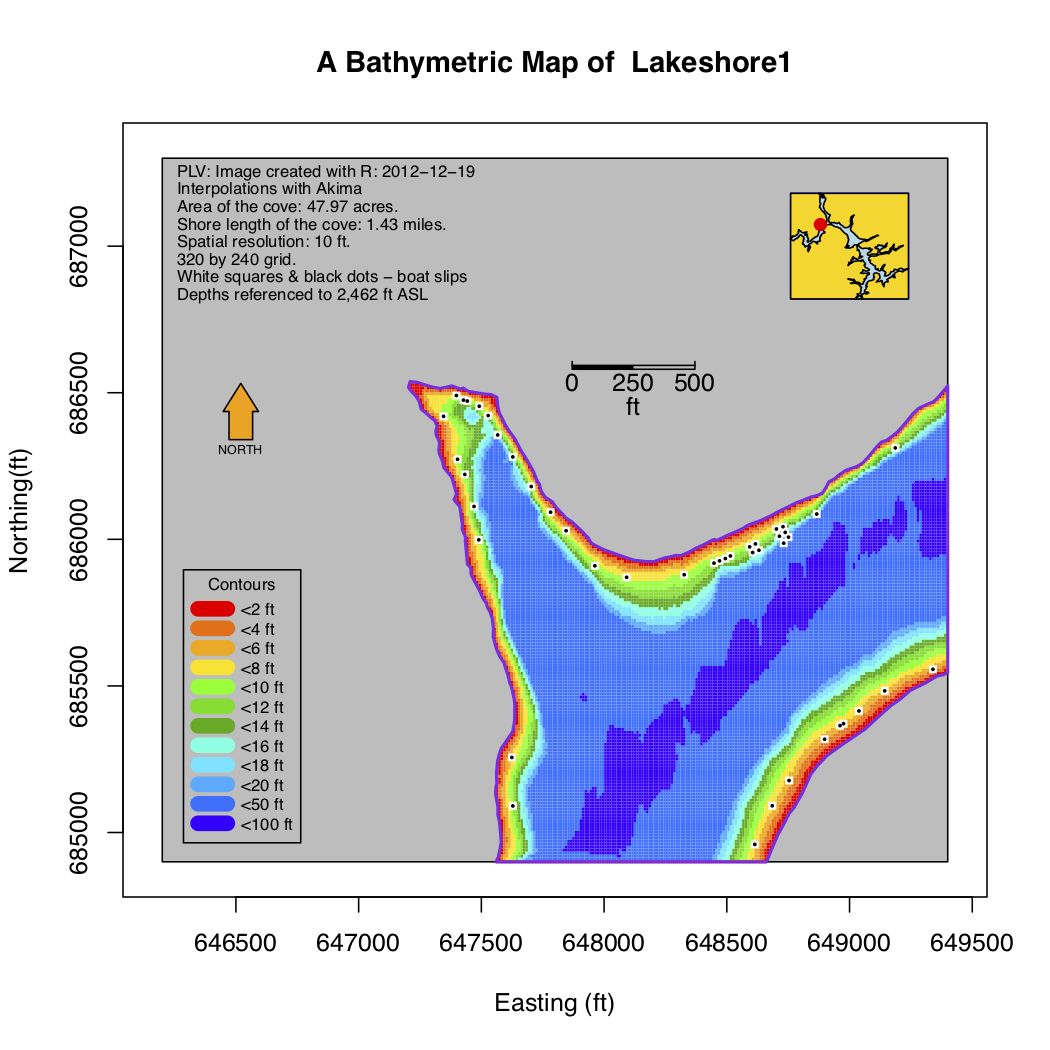
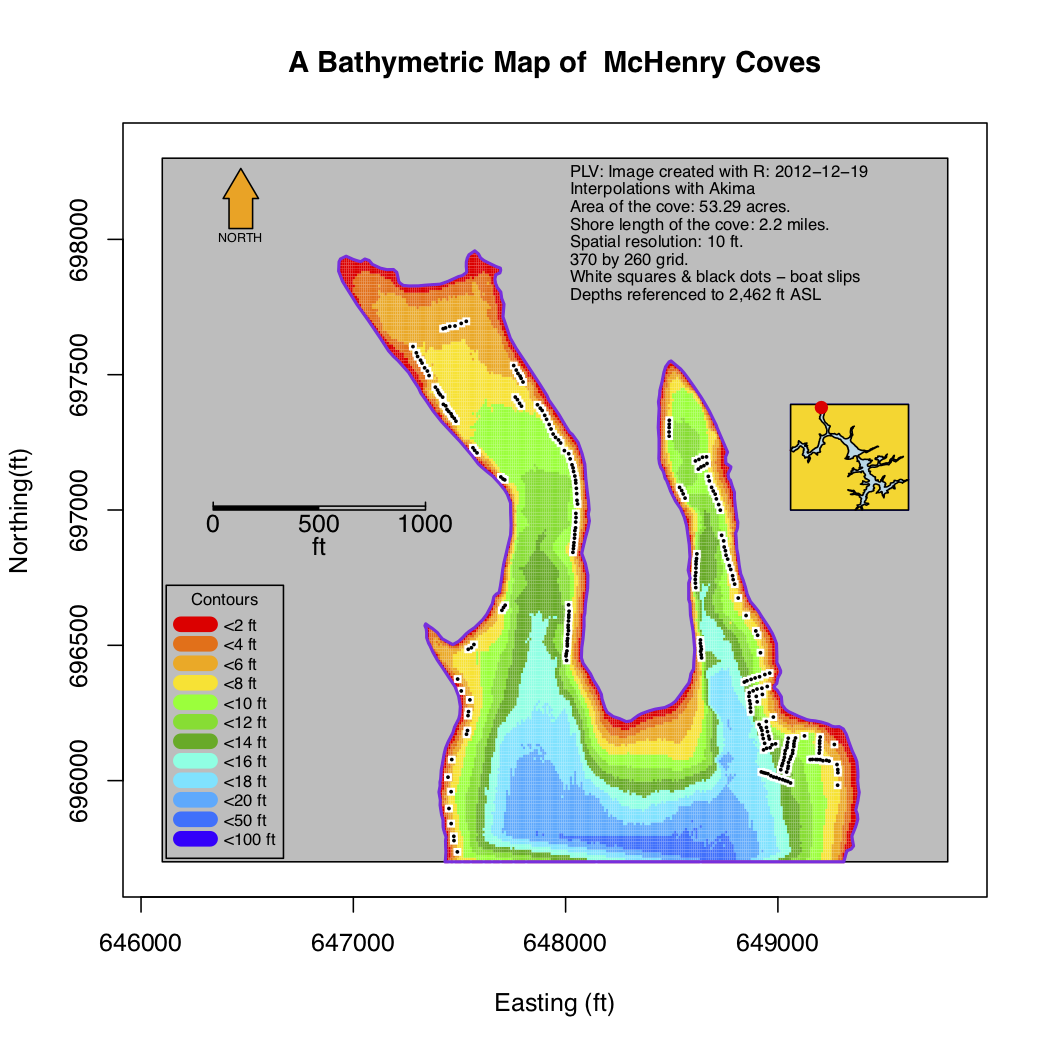
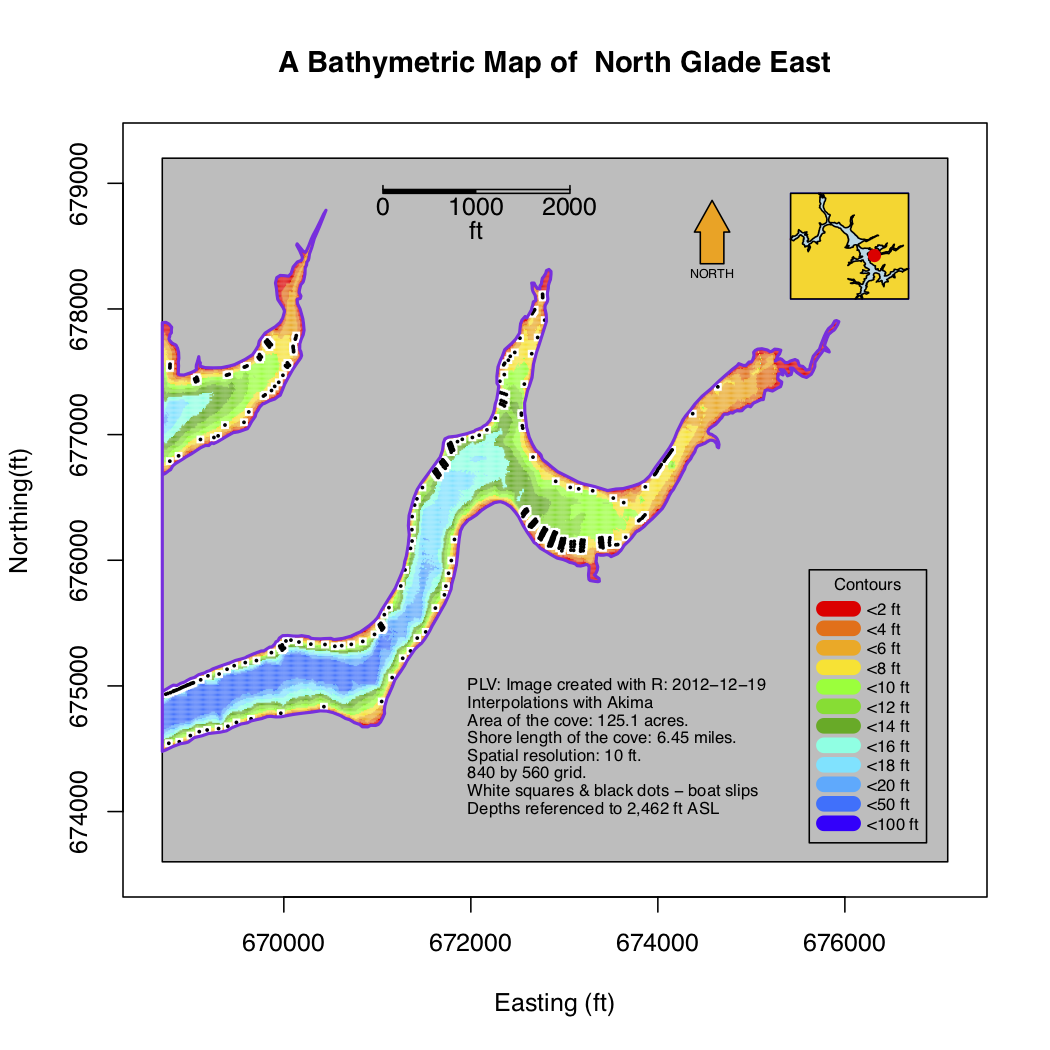
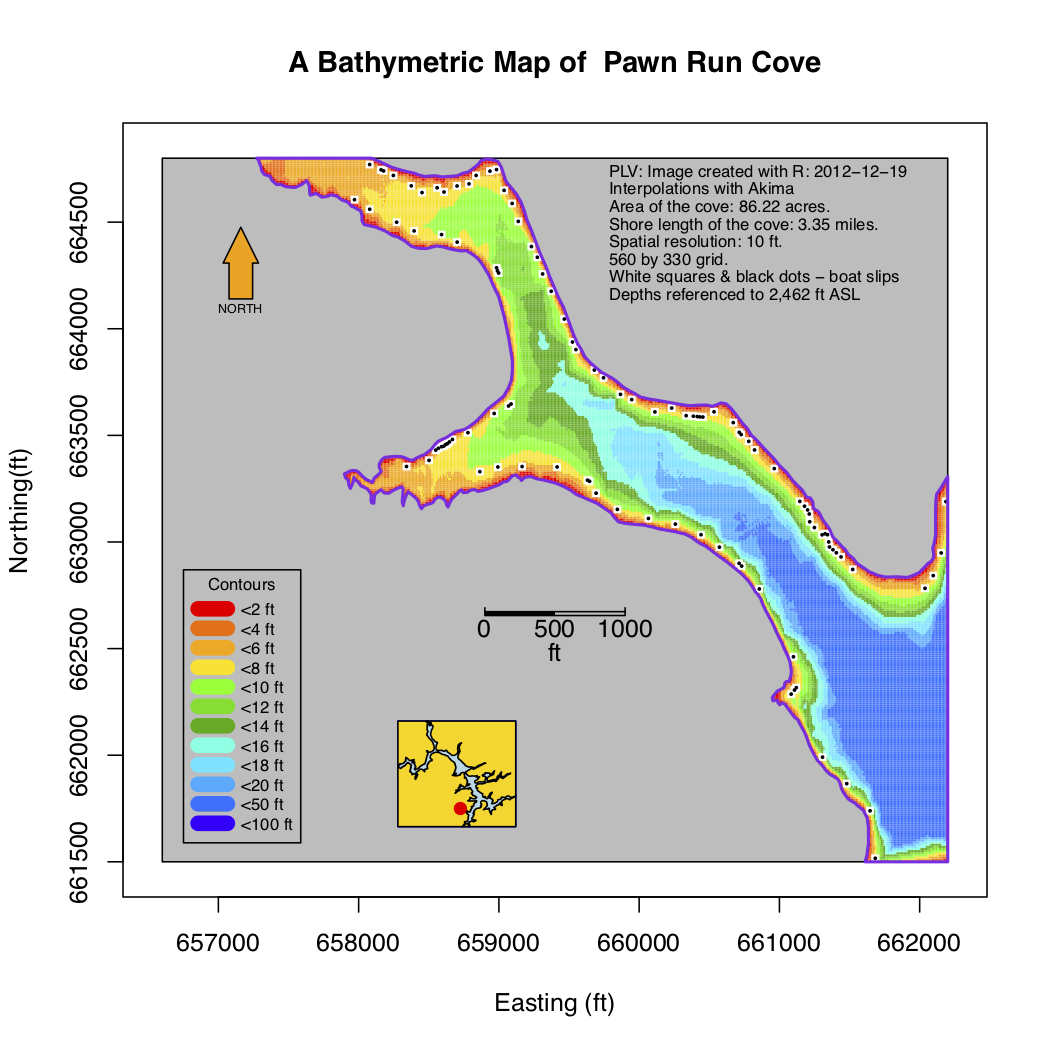
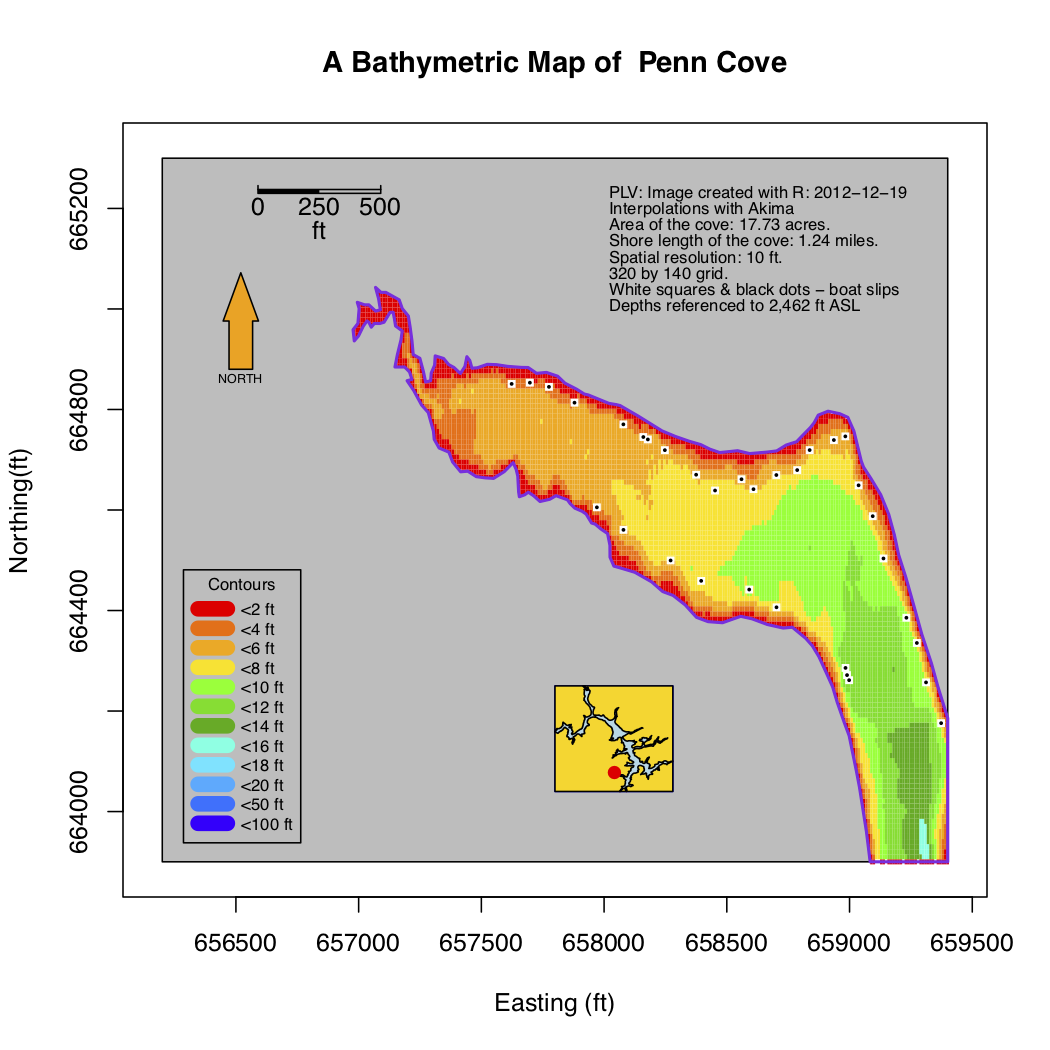
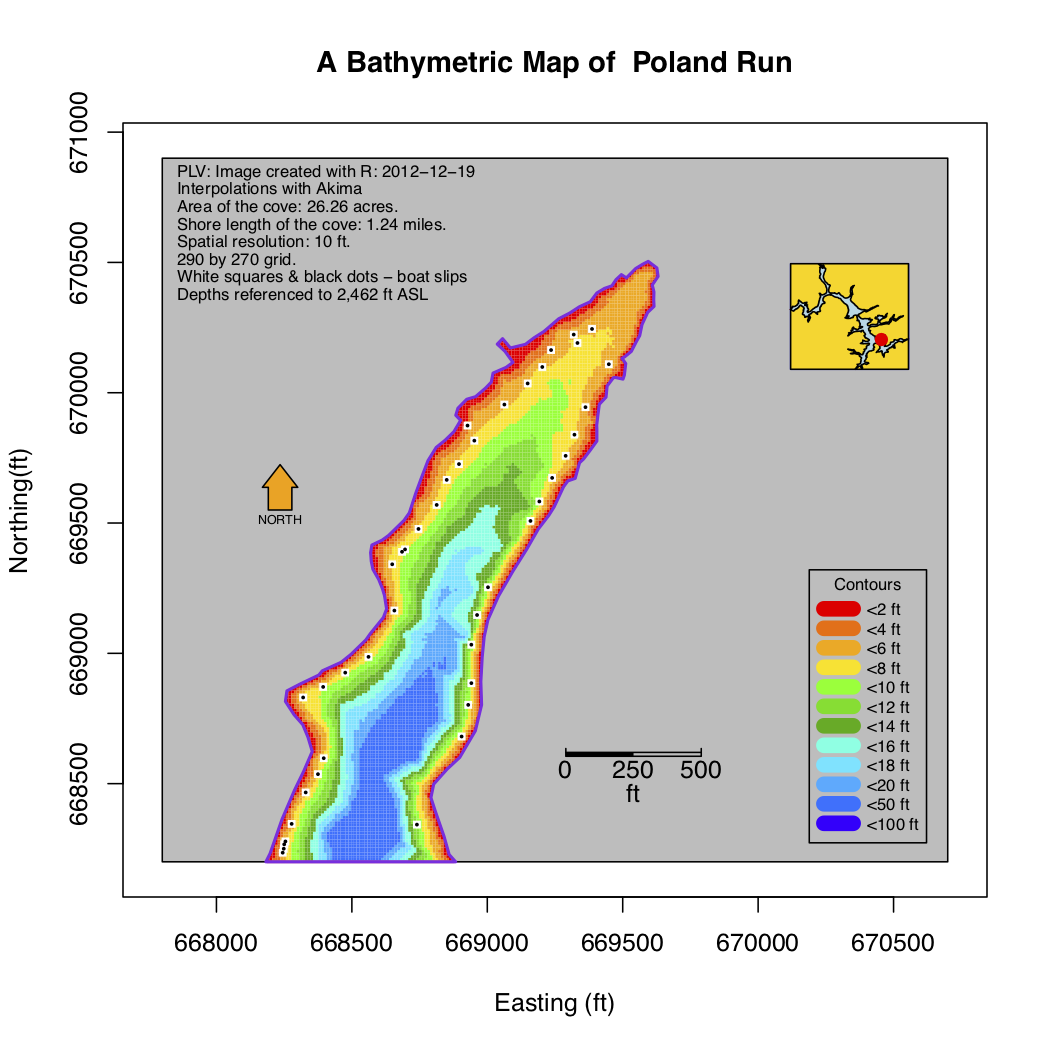
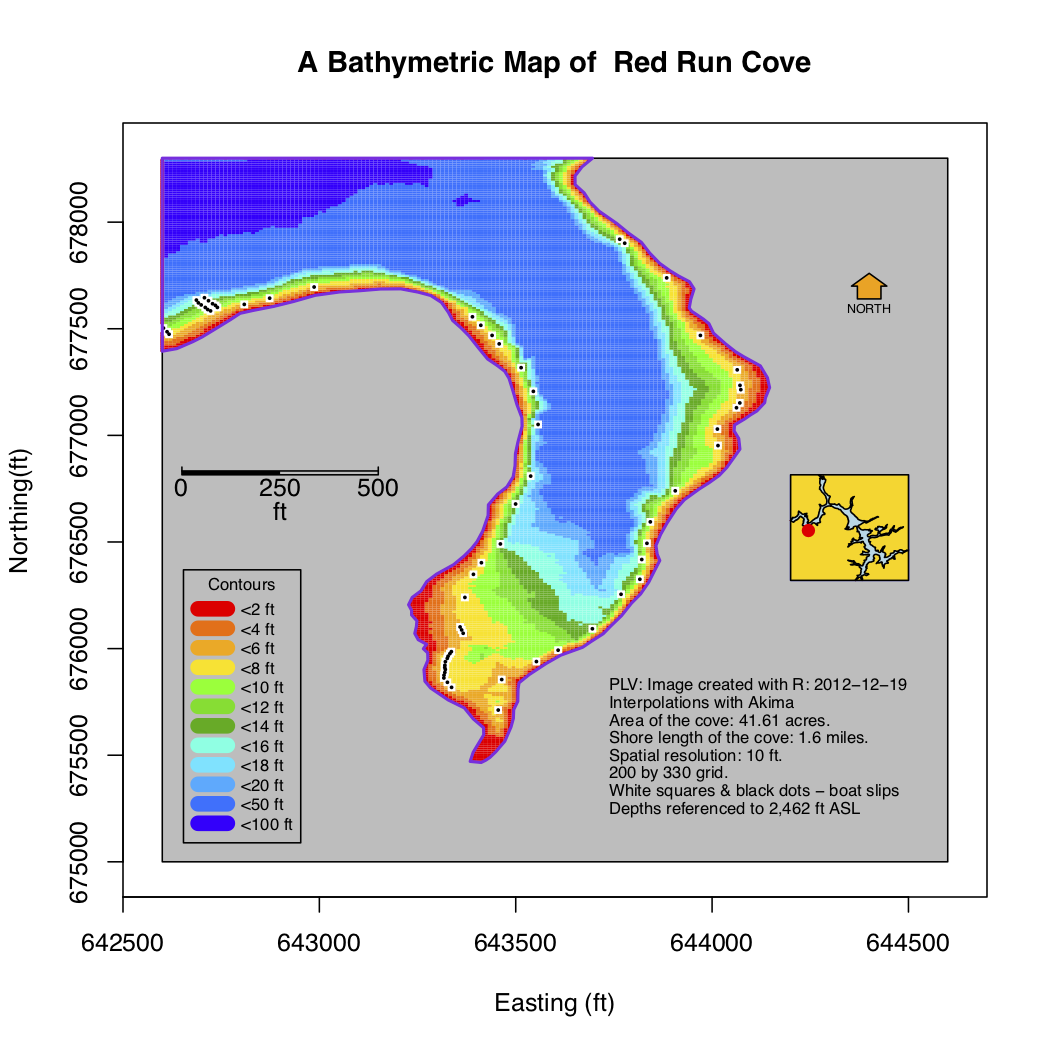
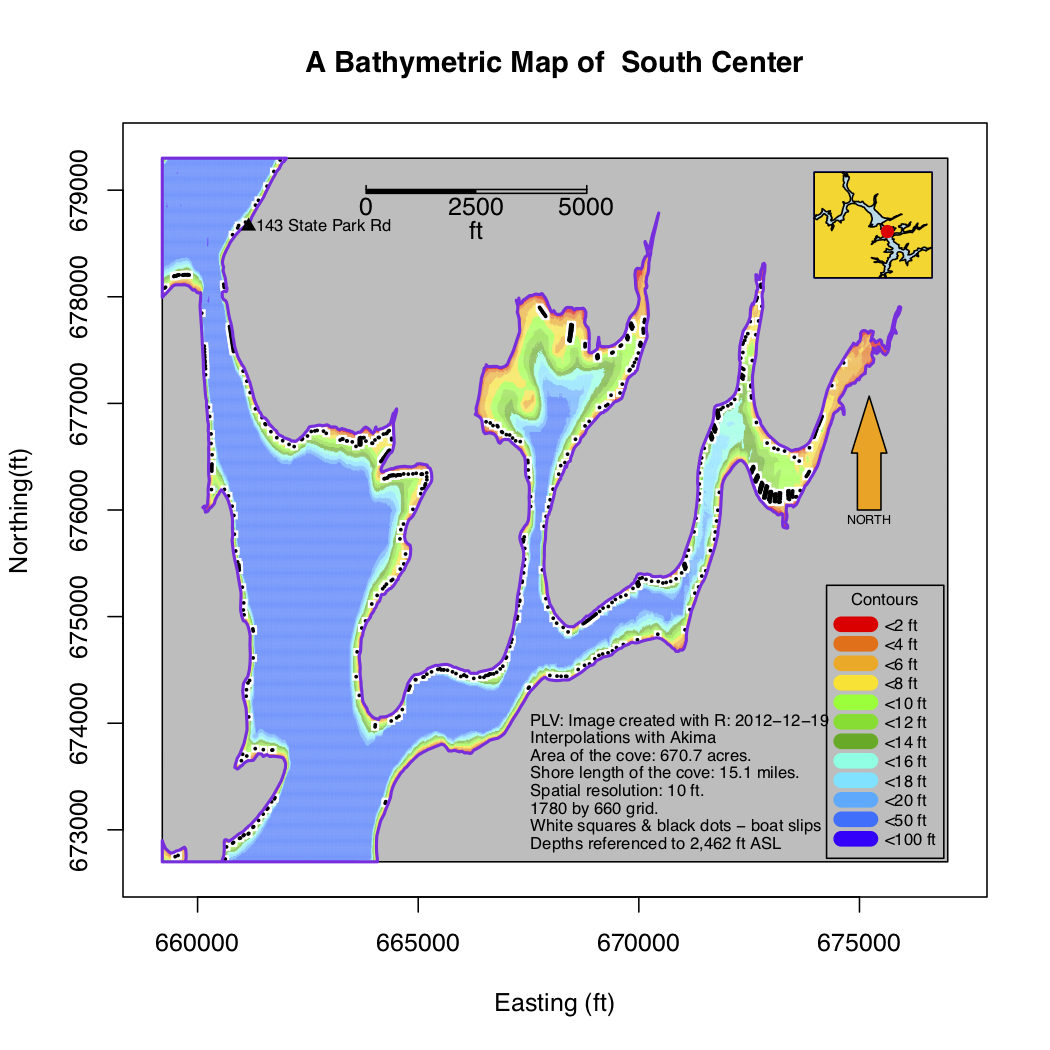
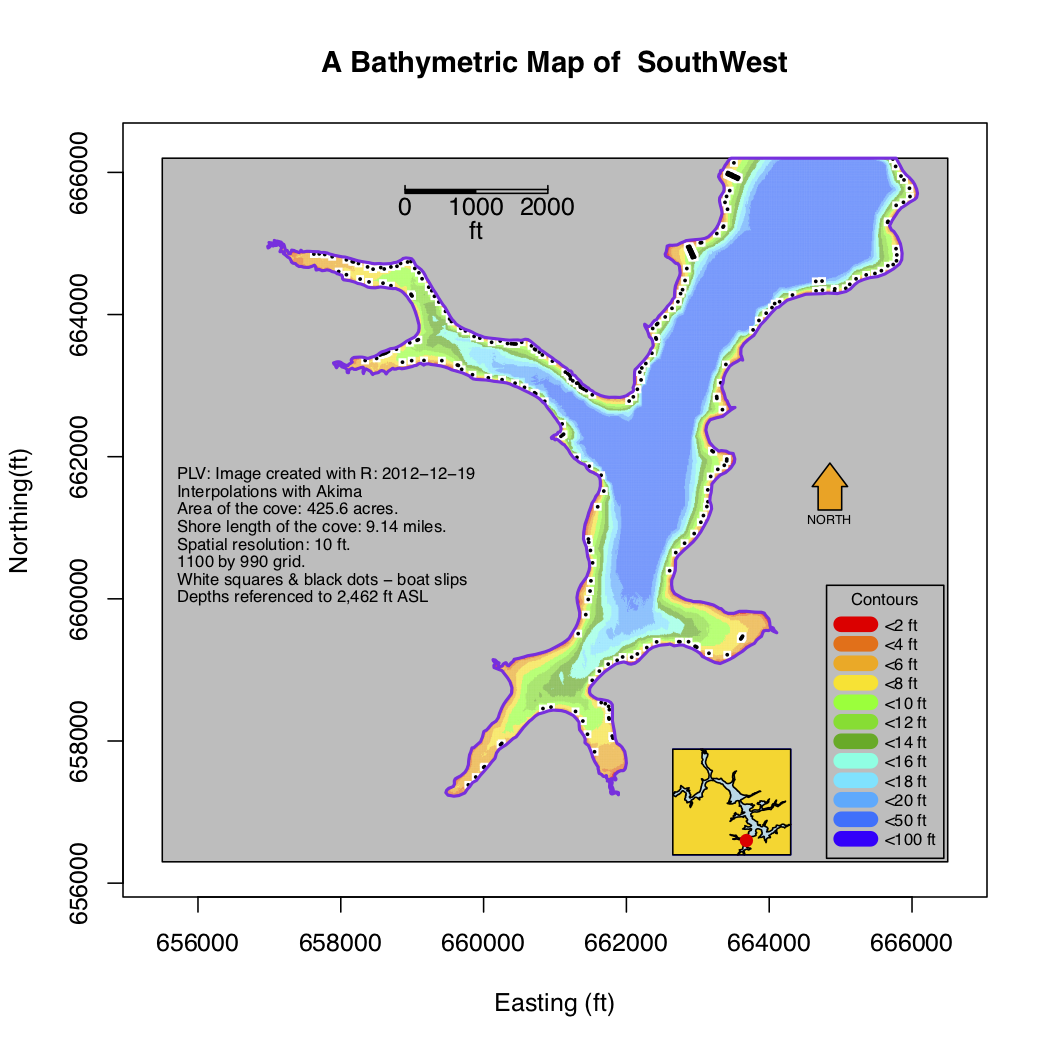
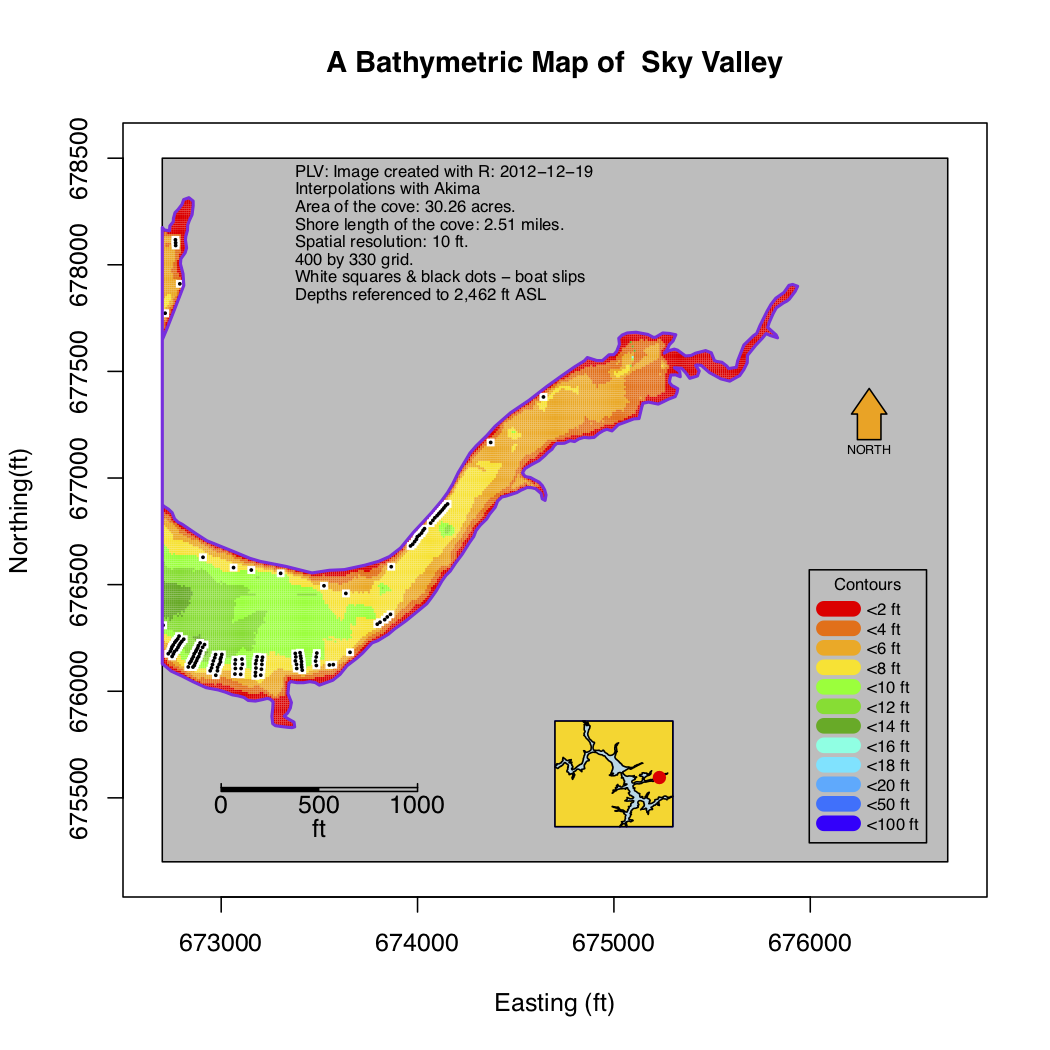
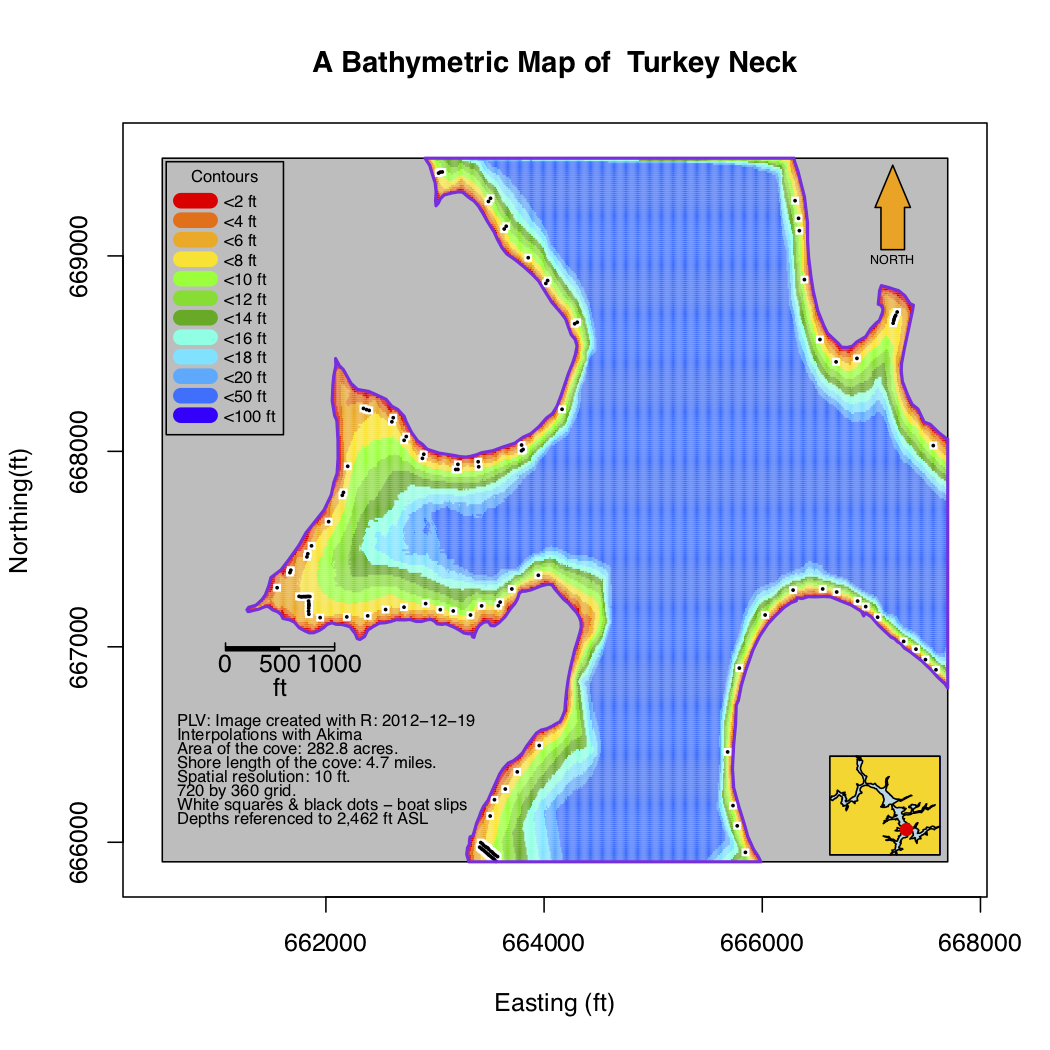
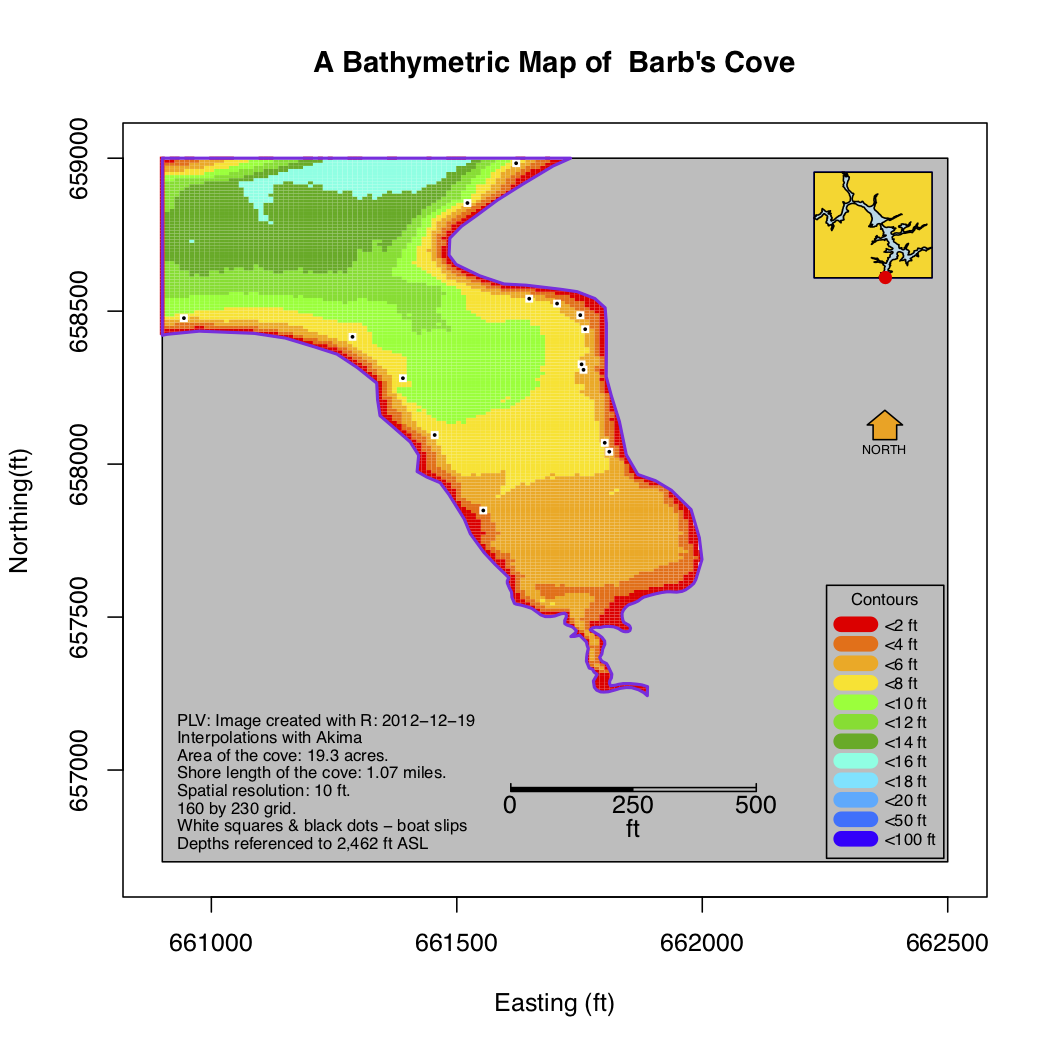
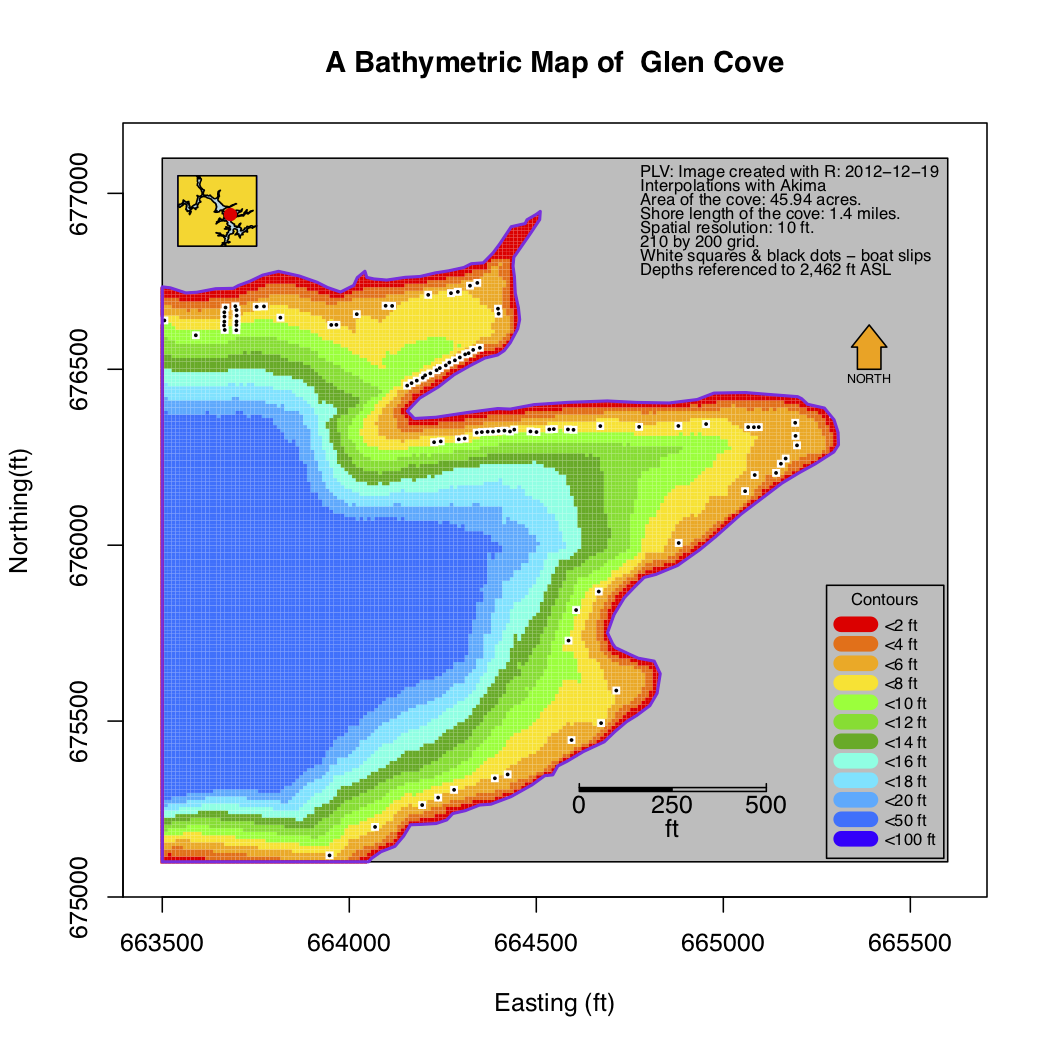
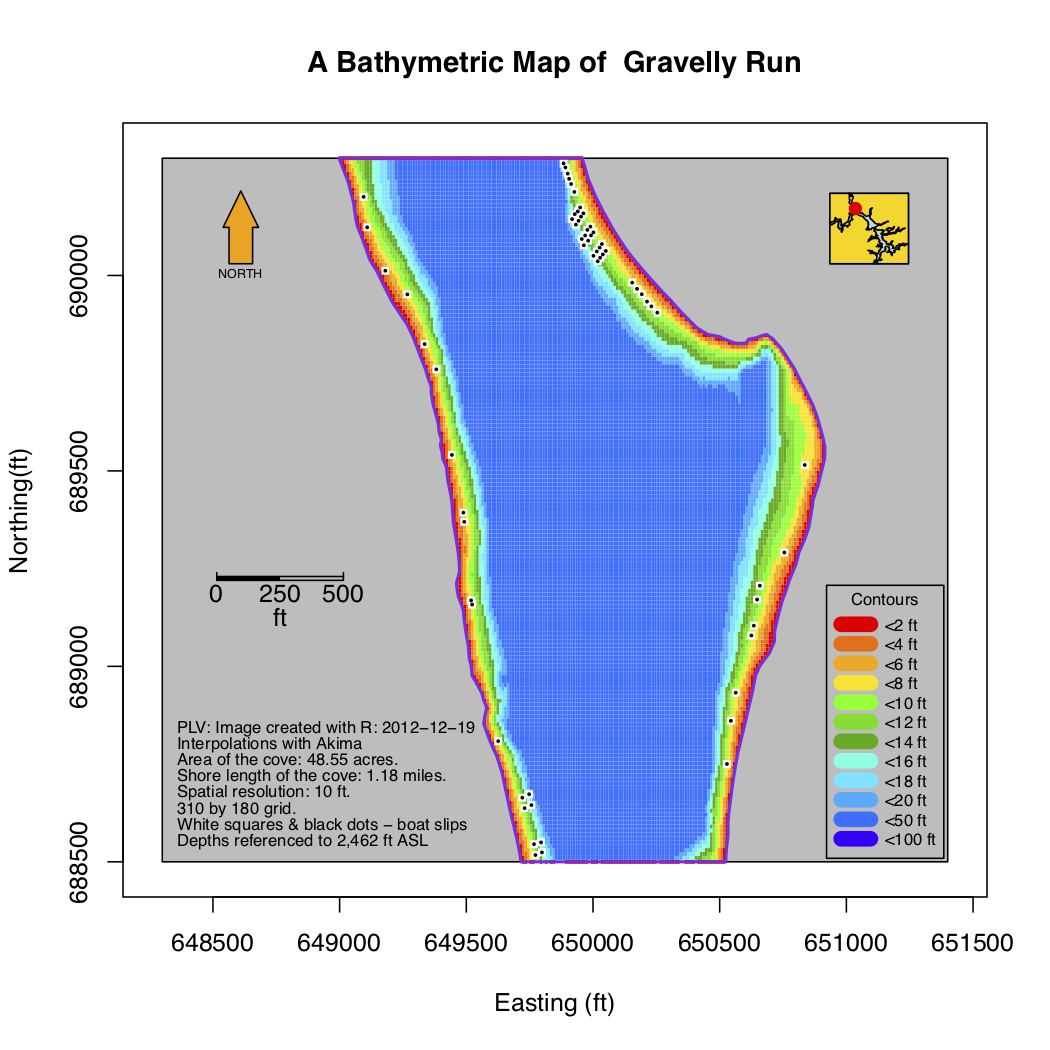
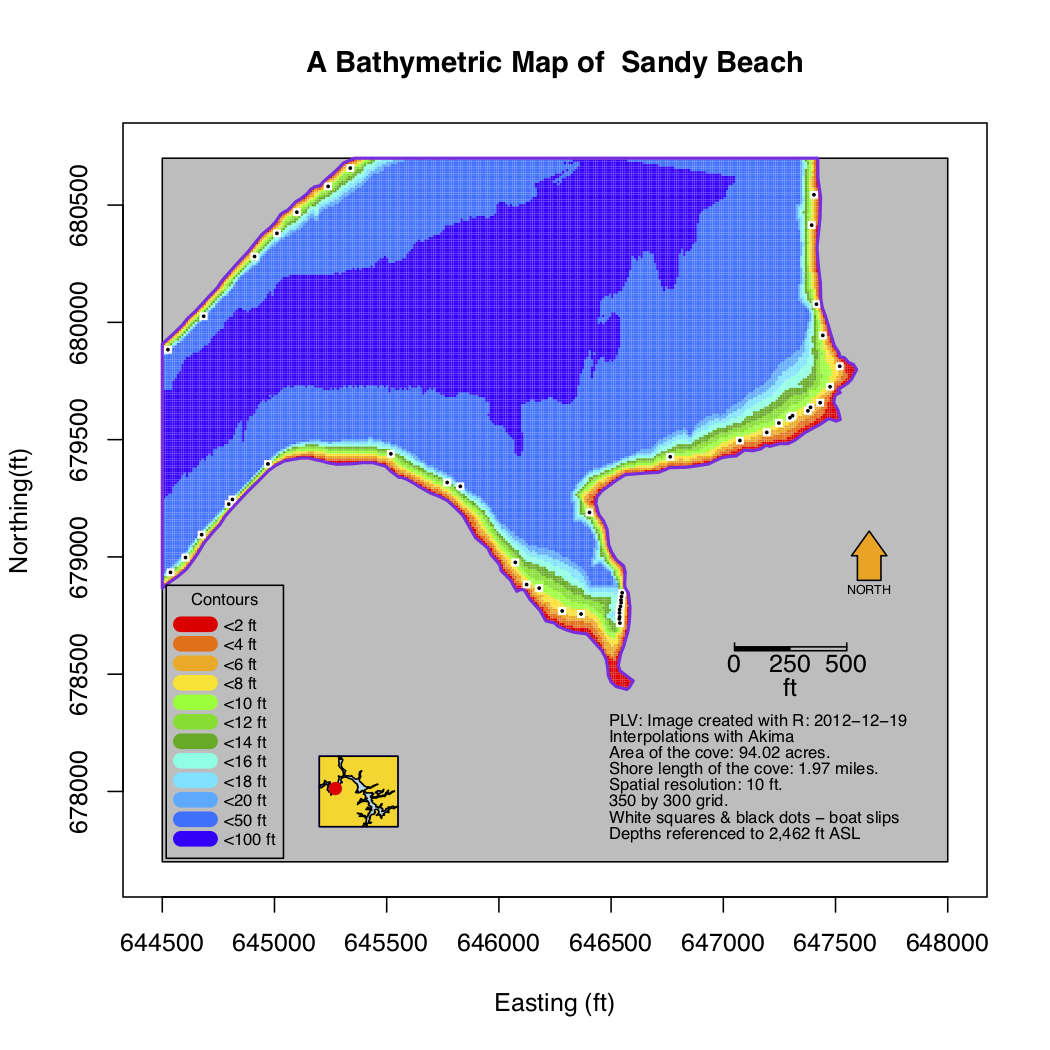
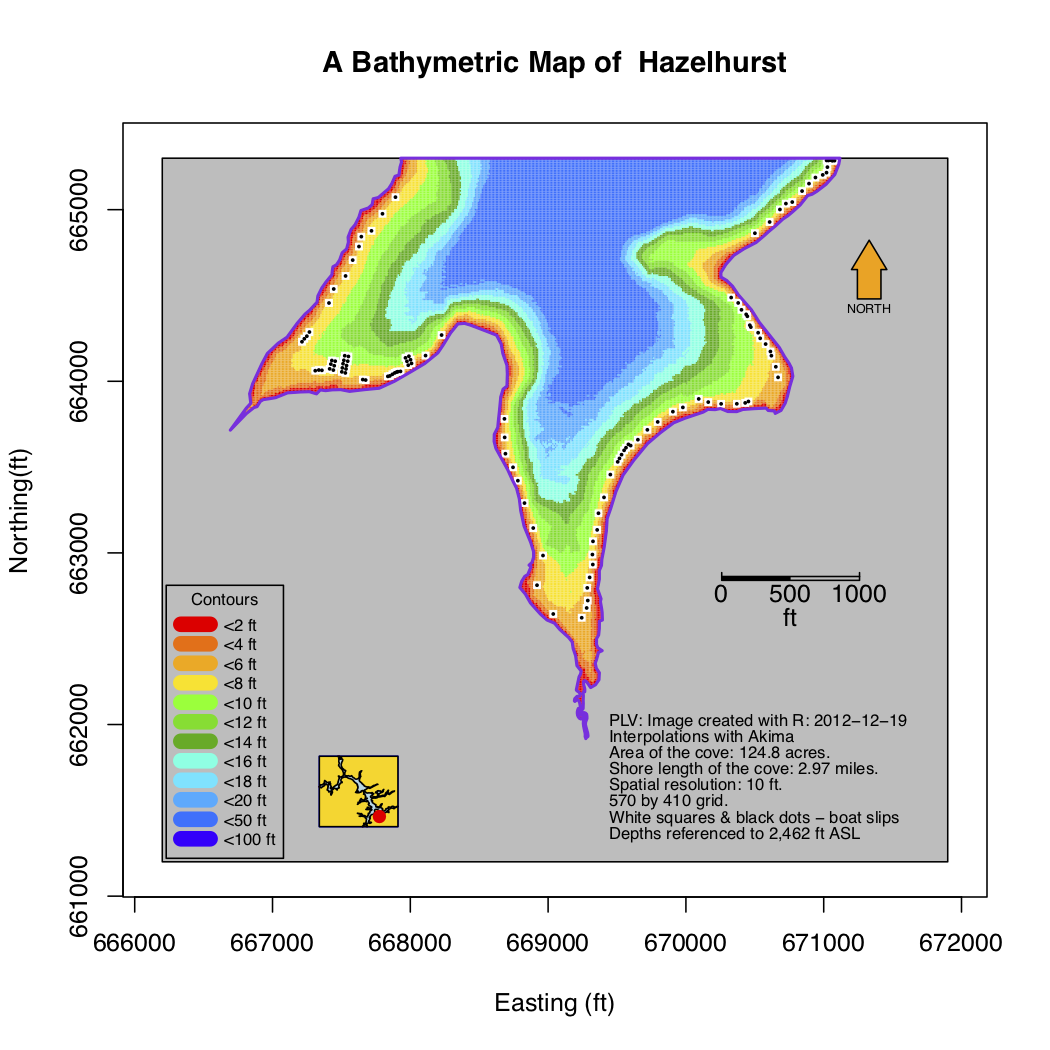
In 2012 I developed bathymetric maps of many coves around Deep Creek Lake, using the bathymetric data collected by DNR during April of 2012. A nonlinear interpolation scheme was used to derive depth data for points missing on the maps.
The bathymetry of Deep Creek Lake[^1] consists of many maps, for two reasons:
The software I used, “R”, cannot[^2] do the whole lake at the resolution that I desire, namely 10 ft. This has to do with R being able to generally run in memory only, and the matrix manipulations required for the whole lake at the desired resolution requires too much RAM, more than the 12 Gb that I had at that time (2012).
A large map cannot contain the level of detail that small scale maps can. I did generate a large map eventually at a resolution of 20 ft x 20ft and using only evry 50th of the data points. This is shown in Figure 1.
Figure 1 - The Whole Lake Bathymetry.
The computation of contours from many irregularly spaced data points can be a difficult problem. This is not an uncommon scientific or mathematical need. As a result many algorithms have been developed, often for very special purpose applications. Think for example where weather stations are located, collecting temperatures, pressures, humidity, wind speeds and direction, rainfall, and solar radiation, all at certain time intervals, and how this information is interpolated to give values at arbitrary locations.
For our purposes, I have focussed on using the Akima[^3] scheme of interpolating. Over many years of working with data, I have found this algorithm to be quit reliable. The R community has not embraced this algorithm too much because the author still claims certain copyrights, which is against the philosophy of the R platform, it being open and unrestricted.
At the time this work was done, the R management group was soliciting for a software developer to write unrestricted software for this algorithm. The most recent update of the ‘akima’ software on R dates to 2015 and still contains a restricted license for using it. Fortunately, this does not matter for our purposes because we’re using it for a research application and not for financial gain.
The results provided here, later on on this page, were generated with the older version of the Akima algorithm. A future note will delve into how different the revised algorithm is. It’s expected not to make much difference, given the basic uncertainties inherent in interpolating data that are irregularly spaced.
There are three folders/directories containing the resulting maps:
1. Akima
2. Akima2
3. Loess
Akima is the interpolation scheme for producing the maps, while Loess is a smoothing scheme. The Akima folder contains maps in which the contours are just shown as colors. Akima2 contains, in addition, contour lines.
The filename for each map encodes the name of the cove or area, the resolution of the map in ft, and the mapping scheme, for its name, either akima or Loess. Use whatever you feel comfortable with, after all they are all approximations. The mathematical and programming details will be explained in future notes, as a review and document the process.
The areas for which maps exist are shown on an overall map as shown in Figure 2.
Figure 2 - The Cove Locations For Which Detailed Maps Exist.
Here are all of the areas for which I have produced bathymetric maps based on DNRs data of April 2012. They are the names for the following coves/areas:
| Map # | Name | Identifier |
|---|---|---|
| 1 | Anglers Cove | Anglers |
| 2 | Arrowhead Cove | Arrowhead |
| 3 | Blakeslee | Blakeslee |
| 4 | Carmel Cove | Carmel |
| 5 | Cherry Creek Cove | CherryCreek |
| 6 | Dam | Dam |
| 7 | Deep Creek Cove | DeepCreek |
| 8 | Deep Creek Bridge | DeepCreekBridge |
| 9 | East Deep Creek Bridge | East Deep Creek Bridge |
| 10 | Glendale Bridge | GlendaleBridge |
| 11 | Green Glade Cove | GreenGlade |
| 12 | Green Glade All | GreenGladeAll |
| 13 | Harveys Cove | Harveys |
| 14 | Hickory Ridge | HickoryRidge |
| 15 | High Mountain Sport | HMS |
| 16 | Hoop Pole | HoopPole |
| 17 | Lakeshore1 | Lakeshore1 |
| 18 | Lakeshore2 | Lakeshore2 |
| 19 | McHenry Cove | McHenry |
| 20 | North Glade East | NorthGladeEast |
| 21 | Pawn Run Cove | PawnRun |
| 22 | Penn Cove | Penn |
| 23 | Poland Run | Poland |
| 24 | Red Run Cove | RedRun |
| 25 | South Center | SouthCenter |
| 26 | South West | SouthWest |
| 27 | Sky Valley | SkyValley |
| 28 | Turkey Neck | TurkeyNeck |
| 29 | Barb’s Cove | BarbsCove |
| 30 | Glen Cove | GlenCove |
| 31 | Gravelly Run | GravellyRun |
| 32 | Sandy Beach | SandyBeach |
| 33 | Hazelhurst | Hazelhurs |
If other maps are needed just give me the longitude and latitude of the center of the area you want and a rough radius around that point and I’ll try to generate one.